LiveCharts.AI › Cross instrument
Do these two markets actually move together?
Educational reference. Measured from recorded market data across 166 instrument pairs.
Two markets are often assumed to move together, or to hedge one another. These pages measure it rather than assume it: for every pair below, how often both instruments moved the same direction on the same bar, across thousands of time aligned bars, on each timeframe. Pages are published only where a real relationship exists.
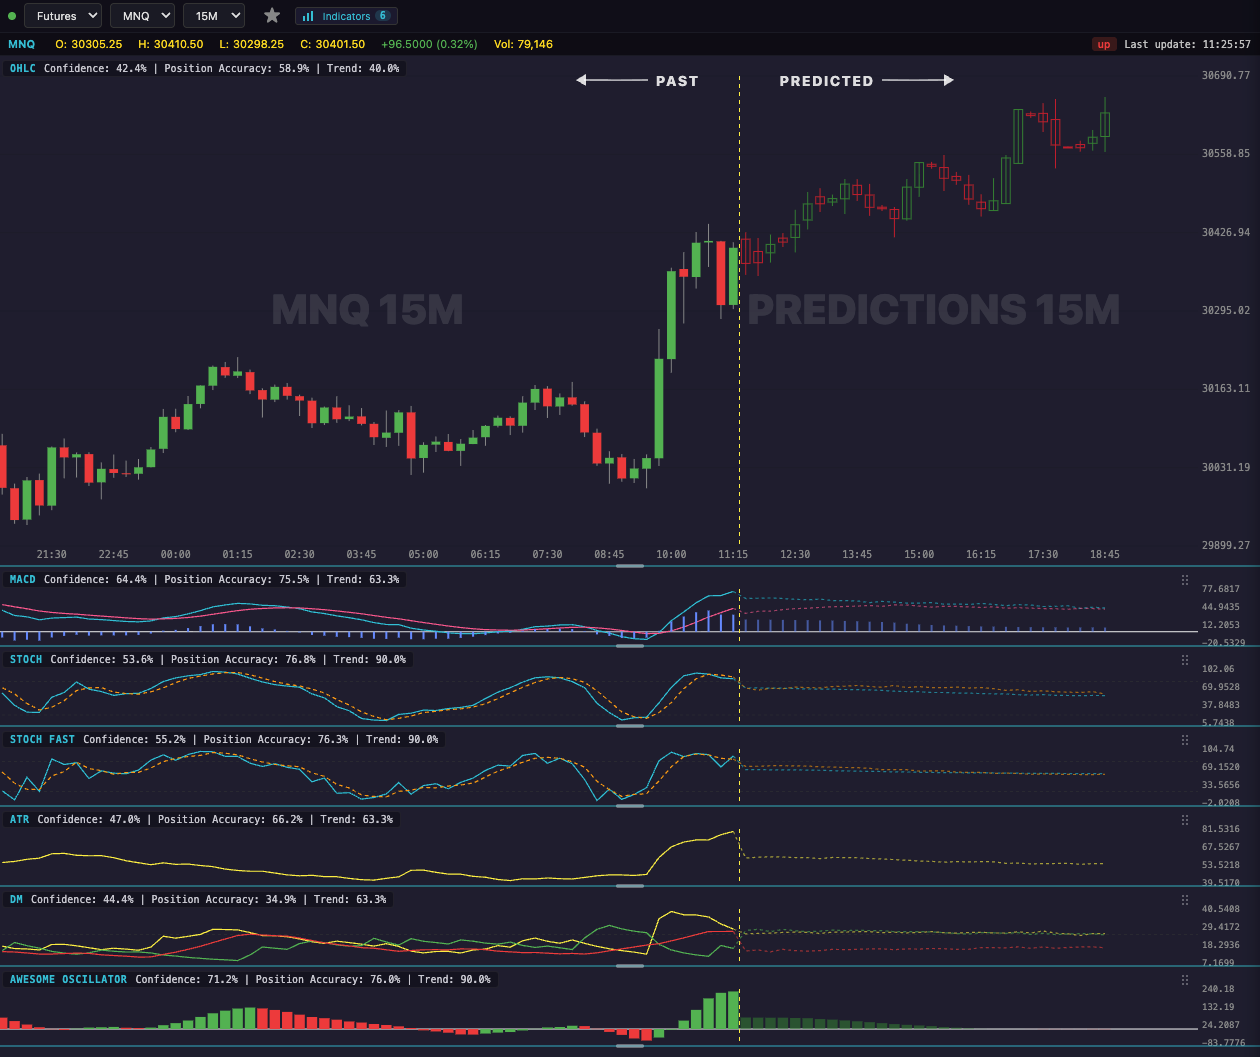
Each pair also has per indicator pages — whether two markets agree on MACD, RSI or ADX is a different question from whether their prices agree, and the answers often differ.
- 6E and EURCAD — 1m · 5m · 10m · 15m
- 6E and EURUSD — 1m
- 6E and GBPUSD — 1m · 5m · 10m · 15m
- 6E and GC — 1m · 5m · 10m · 15m · 30m
- 6E and M2K — 5m · 15m · 30m
- 6E and M6E — 1m · 5m · 10m · 15m · 30m
- 6E and MGC — 1m · 5m · 10m · 15m · 30m
- 6E and RTY — 30m
- 6E and SI — 5m · 10m · 15m · 30m
- 6E and SIL — 5m · 10m · 15m · 30m
- 6E and USDCAD — 1m · 5m · 10m · 15m
- 6E and ZN — 5m · 10m · 15m · 30m
- BIT and BTCUSD — 1m · 5m · 10m
- BIT and ETHUSD — 1m · 5m · 10m · 15m · 30m
- BIT and MBT — 1m · 5m · 10m · 15m
- BIT and MET — 1m · 5m · 10m · 15m · 30m
- BTCUSD and ETHUSD — 1m · 5m · 10m · 15m · 30m
- BTCUSD and MBT — 1m · 5m · 10m
- BTCUSD and MET — 1m · 5m · 10m · 15m · 30m
- BTCUSD and MNQ — 5m · 10m · 15m · 30m
- BTCUSD and NQ — 5m · 10m · 15m · 30m
- CL and ES — 30m
- CL and EURCAD — 1m · 10m · 15m
- CL and M2K — 5m · 10m · 15m · 30m
- CL and MCL — 5m · 15m
- CL and MES — 30m
- CL and RTY — 5m · 10m · 15m · 30m
- CL and ZN — 10m · 15m · 30m
- ES and EURCAD — 5m · 10m · 15m
- ES and EURUSD — 1m · 5m · 10m · 15m
- ES and GBPUSD — 1m · 5m · 10m · 15m
- ES and GC — 1m · 5m · 10m · 15m · 30m
- ES and M2K — 1m · 5m · 10m · 15m · 30m
- ES and MCL — 30m
- ES and MGC — 1m · 5m · 10m · 15m · 30m
- ES and MNQ — 1m · 5m · 10m · 15m · 30m
- ES and MYM — 1m · 5m · 10m · 15m · 30m
- ES and NQ — 1m · 5m · 10m · 15m · 30m
- ES and RTY — 1m · 5m · 10m · 15m · 30m
- ES and SI — 1m · 5m · 10m · 15m · 30m
- ES and SIL — 1m · 5m · 10m · 15m · 30m
- ES and SPY — 1m
- ES and YM — 1m · 5m · 10m · 15m · 30m
- ES and ZN — 15m · 30m
- ETHUSD and MBT — 1m · 5m · 10m · 15m · 30m
- ETHUSD and MET — 1m · 5m · 10m · 15m · 30m
- ETHUSD and MNQ — 5m · 10m · 15m · 30m
- ETHUSD and NQ — 5m · 10m · 15m · 30m
- EURCAD and EURUSD — 1m · 5m · 10m · 15m
- EURCAD and GBPUSD — 1m · 5m · 10m · 15m
- EURCAD and M6E — 1m · 5m · 10m · 15m
- EURCAD and MCL — 1m · 5m · 10m · 15m
- EURCAD and MES — 5m · 10m · 15m
- EURCAD and MNQ — 1m · 5m · 10m · 15m
- EURCAD and NQ — 1m · 5m · 10m · 15m
- EURCAD and USDCAD — 1m · 5m · 10m · 15m
- EURUSD and GBPUSD — 1m · 5m · 10m · 15m
- EURUSD and GC — 1m · 5m · 10m
- EURUSD and M6E — 1m · 5m · 10m
- EURUSD and MES — 1m · 5m · 10m · 15m
- EURUSD and MGC — 1m · 5m · 10m
- EURUSD and MNQ — 1m · 5m · 10m · 15m
- EURUSD and NQ — 1m · 5m · 10m · 15m
- EURUSD and SI — 5m · 10m
- EURUSD and SIL — 5m · 10m
- EURUSD and SPY — 1m · 5m
- EURUSD and USDCAD — 1m · 5m · 10m · 15m
- EURUSD and ZN — 5m · 10m · 15m
- GBPUSD and GC — 1m · 5m · 10m
- GBPUSD and M6E — 1m · 5m · 10m · 15m
- GBPUSD and MES — 1m · 5m · 10m · 15m
- GBPUSD and MGC — 1m · 5m · 10m
- GBPUSD and MNQ — 1m · 5m · 10m · 15m
- GBPUSD and NQ — 1m · 5m · 10m · 15m
- GBPUSD and SI — 10m
- GBPUSD and SIL — 10m
- GBPUSD and SPY — 1m · 5m
- GBPUSD and USDCAD — 1m · 5m · 10m · 15m
- GBPUSD and ZN — 5m · 10m
- GC and M2K — 1m · 5m · 10m · 15m · 30m
- GC and M6E — 5m · 10m · 15m · 30m
- GC and MES — 1m · 5m · 10m · 15m · 30m
- GC and MGC — 1m · 5m · 15m · 30m
- GC and MNQ — 1m · 5m · 10m · 15m · 30m
- GC and MYM — 10m · 15m · 30m
- GC and NQ — 1m · 5m · 10m · 15m · 30m
- GC and RTY — 1m · 5m · 10m · 15m · 30m
- GC and SI — 1m · 5m · 10m · 15m · 30m
- GC and SIL — 1m · 5m · 10m · 15m · 30m
- GC and USDCAD — 1m · 10m
- GC and YM — 1m · 30m
- GC and ZN — 5m · 10m · 15m · 30m
- M2K and MCL — 5m · 10m · 15m · 30m
- M2K and MES — 1m · 5m · 10m · 15m · 30m
- M2K and MGC — 1m · 5m · 10m · 15m · 30m
- M2K and MNQ — 1m · 5m · 10m · 15m · 30m
- M2K and MYM — 1m · 5m · 10m · 15m · 30m
- M2K and NQ — 1m · 5m · 10m · 15m · 30m
- M2K and SI — 1m · 5m · 10m · 15m · 30m
- M2K and SIL — 1m · 5m · 10m · 15m · 30m
- M2K and SPY — 1m
- M2K and YM — 1m · 5m · 10m · 15m · 30m
- M2K and ZN — 5m · 10m · 15m · 30m
- M6E and MGC — 1m · 5m · 10m · 15m · 30m
- M6E and SI — 15m · 30m
- M6E and SIL — 5m · 10m · 15m · 30m
- M6E and USDCAD — 1m · 5m · 10m · 15m
- M6E and ZN — 5m · 10m · 15m · 30m
- MBT and MET — 1m · 5m · 10m · 15m · 30m
- MBT and MNQ — 10m
- MBT and NQ — 10m
- MCL and MES — 30m
- MCL and RTY — 5m · 10m · 15m · 30m
- MCL and SPY — 1m
- MCL and ZN — 5m · 10m · 15m · 30m
- MES and MGC — 1m · 5m · 10m · 15m · 30m
- MES and MNQ — 1m · 5m · 10m · 15m · 30m
- MES and MYM — 1m · 5m · 10m · 15m · 30m
- MES and NQ — 1m · 5m · 10m · 15m · 30m
- MES and RTY — 1m · 5m · 10m · 15m · 30m
- MES and SI — 1m · 5m · 10m · 15m · 30m
- MES and SIL — 1m · 5m · 10m · 15m · 30m
- MES and SPY — 1m
- MES and YM — 1m · 5m · 10m · 15m · 30m
- MES and ZN — 15m · 30m
- MGC and MNQ — 1m · 5m · 10m · 15m · 30m
- MGC and MYM — 1m · 10m · 15m · 30m
- MGC and NQ — 1m · 5m · 10m · 15m · 30m
- MGC and RTY — 1m · 5m · 10m · 15m · 30m
- MGC and SI — 1m · 5m · 10m · 15m · 30m
- MGC and SIL — 1m · 5m · 10m · 15m · 30m
- MGC and USDCAD — 1m
- MGC and YM — 1m · 30m
- MGC and ZN — 5m · 10m · 15m · 30m
- MNG and NG — 1m · 5m · 10m · 15m
- MNQ and MYM — 1m · 5m · 10m · 15m · 30m
- MNQ and RTY — 1m · 5m · 10m · 15m · 30m
- MNQ and SI — 1m · 5m · 10m · 15m · 30m
- MNQ and SIL — 1m · 5m · 10m · 15m · 30m
- MNQ and SPY — 1m · 5m
- MNQ and YM — 1m · 5m · 10m · 15m · 30m
- MYM and NQ — 1m · 5m · 10m · 15m · 30m
- MYM and RTY — 1m · 5m · 10m · 15m · 30m
- MYM and SI — 10m · 15m · 30m
- MYM and SIL — 10m · 15m · 30m
- MYM and SPY — 1m · 5m
- MYM and YM — 1m · 10m · 15m
- MYM and ZN — 10m · 15m · 30m
- NQ and RTY — 1m · 5m · 10m · 15m · 30m
- NQ and SI — 1m · 5m · 10m · 15m · 30m
- NQ and SIL — 1m · 5m · 10m · 15m · 30m
- NQ and SPY — 1m · 5m
- NQ and YM — 1m · 5m · 10m · 15m · 30m
- RTY and SI — 1m · 5m · 10m · 15m · 30m
- RTY and SIL — 1m · 5m · 10m · 15m · 30m
- RTY and SPY — 1m
- RTY and YM — 1m · 5m · 10m · 15m · 30m
- RTY and ZN — 5m · 10m · 15m · 30m
- SI and SIL — 1m · 5m · 10m · 15m · 30m
- SI and SPY — 1m
- SI and YM — 30m
- SI and ZN — 5m · 10m · 15m · 30m
- SIL and YM — 1m · 30m
- SIL and ZN — 5m · 10m · 15m · 30m
- SPY and YM — 1m · 5m
- YM and ZN — 30m