Do GBPUSD and USDCAD Move Together on 15-minute Charts?
Educational reference. Measured from recorded market data through September 12, 2026. Not a forecast.
British Pound / U.S. Dollar and U.S. Dollar / Canadian Dollar are often assumed to move in opposite directions. This measures it against 1,548 time-aligned 15-minute bars over the last 45 days — no opinion, just what the two actually did.
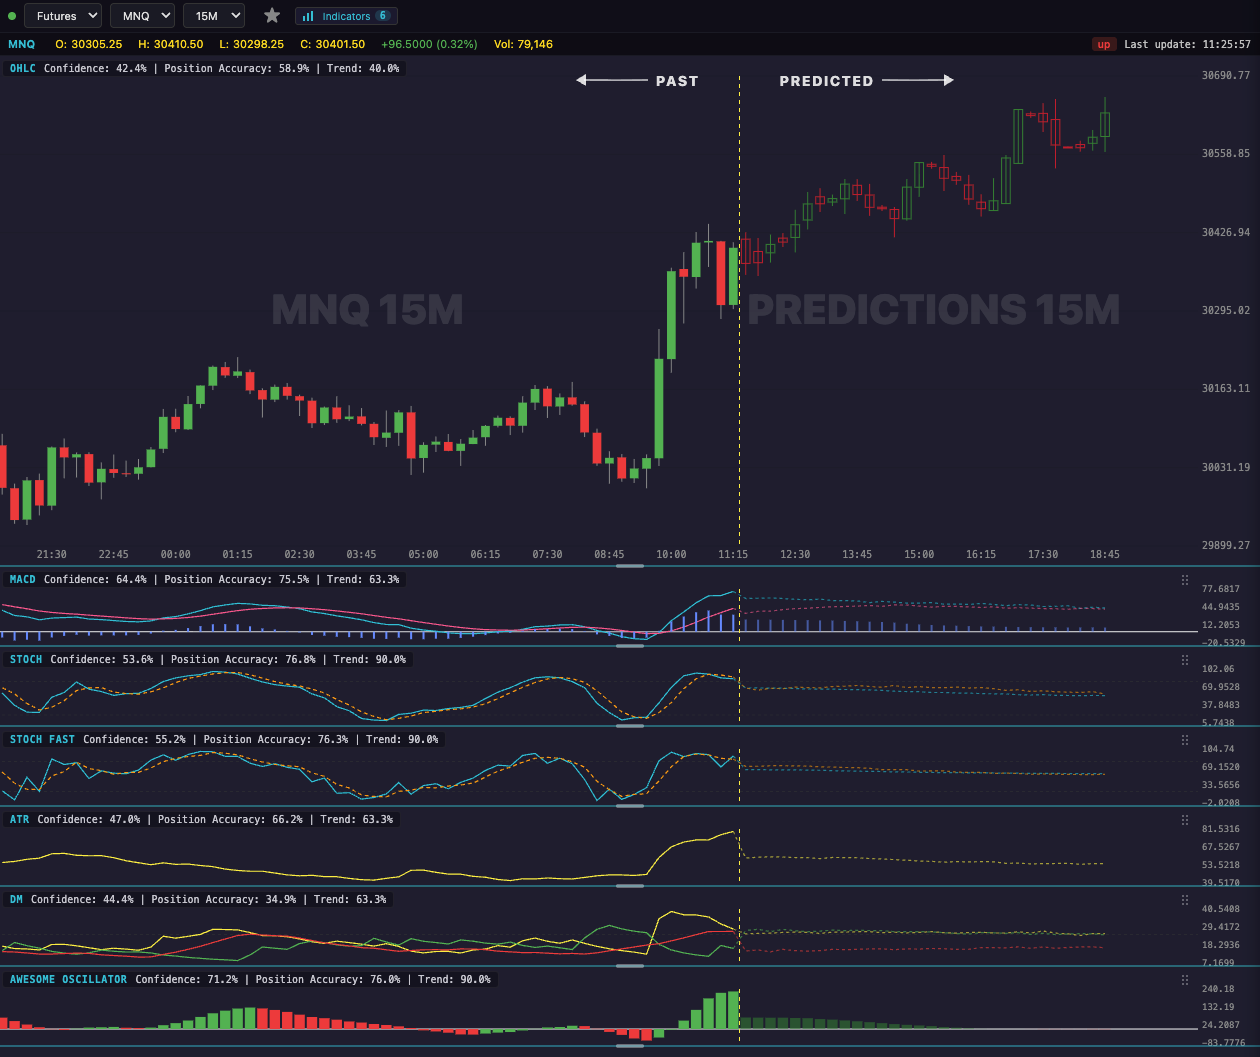
| Bars where both moved | 1,497 |
|---|---|
| … and moved the same direction | 443 (29.6%) |
| Correlation of bar-to-bar changes | -0.574 |
At 29.6% agreement and a correlation of -0.574, these two have a moderate tendency to move in opposite directions on this timeframe.
Where the relationship breaks down
Prices moving together does not mean everything else does. The indicator pages below measure each reading separately — and momentum, trend strength and volatility frequently disagree even when price does not.
See LiveCharts.AI forecasting both GBPUSD and USDCAD live — 7-day free trial →
How this was measured
Every 15-minute bar recorded for both instruments in the last 45 days was aligned by timestamp. Bars where either did not move are excluded from the direction figure, since a flat bar agrees with nothing. Correlation is measured on bar-to-bar changes, not on price levels — two markets can both drift upward for unrelated reasons, and correlating levels would call that a relationship.