LiveCharts.AI › Statistics
Market statistics
Educational reference. Measured from recorded market data through October 18, 2026.
How much each market actually moves, hour by hour. Every figure is the median range of a real bar over the last 90 days — not a prediction, and not an average that a single session can distort.
Euro FX (6E)
- 6E 1 minute — busiest 09:00, 3.0× the quietest hour
- 6E 5 minute — busiest 09:00, 4.0× the quietest hour
- 6E 10 minute — busiest 10:00, 3.7× the quietest hour
- 6E 15 minute — busiest 10:00, 3.5× the quietest hour
Nano Bitcoin (BIT)
- BIT 1 minute — busiest 09:00, 0.0× the quietest hour
- BIT 5 minute — busiest 10:00, 4.0× the quietest hour
- BIT 10 minute — busiest 10:00, 3.3× the quietest hour
- BIT 15 minute — busiest 10:00, 3.2× the quietest hour
Bitcoin (BTCUSD)
- BTCUSD 1 minute — busiest 10:00, 2.8× the quietest hour
- BTCUSD 5 minute — busiest 10:00, 2.6× the quietest hour
- BTCUSD 10 minute — busiest 10:00, 2.4× the quietest hour
- BTCUSD 15 minute — busiest 10:00, 2.5× the quietest hour
Crude Oil (CL)
- CL 1 minute — busiest 09:00, 6.0× the quietest hour
- CL 5 minute — busiest 09:00, 4.8× the quietest hour
- CL 10 minute — busiest 09:00, 4.1× the quietest hour
- CL 15 minute — busiest 09:00, 4.1× the quietest hour
E-mini S&P 500 (ES)
- ES 1 minute — busiest 10:00, 4.0× the quietest hour
- ES 5 minute — busiest 10:00, 4.0× the quietest hour
- ES 10 minute — busiest 10:00, 4.0× the quietest hour
- ES 15 minute — busiest 10:00, 4.2× the quietest hour
Ethereum (ETHUSD)
- ETHUSD 1 minute — busiest 10:00, 2.3× the quietest hour
- ETHUSD 5 minute — busiest 10:00, 2.2× the quietest hour
- ETHUSD 10 minute — busiest 10:00, 2.3× the quietest hour
- ETHUSD 15 minute — busiest 10:00, 2.3× the quietest hour
Euro / Canadian Dollar (EURCAD)
- EURCAD 1 minute — busiest 10:00, 3.1× the quietest hour
- EURCAD 5 minute — busiest 10:00, 3.0× the quietest hour
Euro / U.S. Dollar (EURUSD)
- EURUSD 1 minute — busiest 10:00, 4.0× the quietest hour
- EURUSD 5 minute — busiest 10:00, 4.3× the quietest hour
British Pound / U.S. Dollar (GBPUSD)
- GBPUSD 1 minute — busiest 10:00, 4.4× the quietest hour
- GBPUSD 5 minute — busiest 10:00, 4.2× the quietest hour
Gold (GC)
- GC 1 minute — busiest 09:00, 3.6× the quietest hour
- GC 5 minute — busiest 09:00, 3.4× the quietest hour
- GC 10 minute — busiest 09:00, 3.4× the quietest hour
- GC 15 minute — busiest 09:00, 3.5× the quietest hour
Micro E-mini Russell 2000 (M2K)
- M2K 1 minute — busiest 10:00, 8.5× the quietest hour
- M2K 5 minute — busiest 10:00, 6.0× the quietest hour
- M2K 10 minute — busiest 10:00, 6.1× the quietest hour
- M2K 15 minute — busiest 10:00, 5.9× the quietest hour
Micro Euro FX (M6E)
- M6E 1 minute — busiest 08:00, 0.0× the quietest hour
- M6E 5 minute — busiest 10:00, 4.0× the quietest hour
- M6E 10 minute — busiest 10:00, 5.5× the quietest hour
- M6E 15 minute — busiest 10:00, 3.5× the quietest hour
Micro Bitcoin (MBT)
- MBT 1 minute — busiest 10:00, 0.0× the quietest hour
- MBT 5 minute — busiest 10:00, 3.4× the quietest hour
- MBT 10 minute — busiest 10:00, 2.8× the quietest hour
- MBT 15 minute — busiest 10:00, 2.7× the quietest hour
Micro Crude Oil (MCL)
- MCL 1 minute — busiest 09:00, 4.0× the quietest hour
- MCL 5 minute — busiest 09:00, 3.7× the quietest hour
- MCL 10 minute — busiest 09:00, 3.7× the quietest hour
- MCL 15 minute — busiest 09:00, 3.6× the quietest hour
Micro E-mini S&P 500 (MES)
- MES 1 minute — busiest 10:00, 4.0× the quietest hour
- MES 5 minute — busiest 10:00, 4.1× the quietest hour
- MES 10 minute — busiest 10:00, 4.0× the quietest hour
- MES 15 minute — busiest 10:00, 4.3× the quietest hour
Micro Ether (MET)
- MET 1 minute — busiest 09:00, 0.0× the quietest hour
- MET 5 minute — busiest 10:00, 10.0× the quietest hour
- MET 10 minute — busiest 10:00, 4.2× the quietest hour
- MET 15 minute — busiest 10:00, 3.8× the quietest hour
Micro Gold (MGC)
- MGC 1 minute — busiest 09:00, 3.4× the quietest hour
- MGC 5 minute — busiest 09:00, 3.2× the quietest hour
- MGC 10 minute — busiest 09:00, 2.8× the quietest hour
- MGC 15 minute — busiest 09:00, 3.2× the quietest hour
Micro Natural Gas (MNG)
- MNG 1 minute — busiest 08:00, 0.0× the quietest hour
- MNG 5 minute — busiest 08:00, 10.0× the quietest hour
- MNG 10 minute — busiest 08:00, 7.5× the quietest hour
- MNG 15 minute — busiest 08:00, 6.3× the quietest hour
Micro E-mini Nasdaq 100 (MNQ)
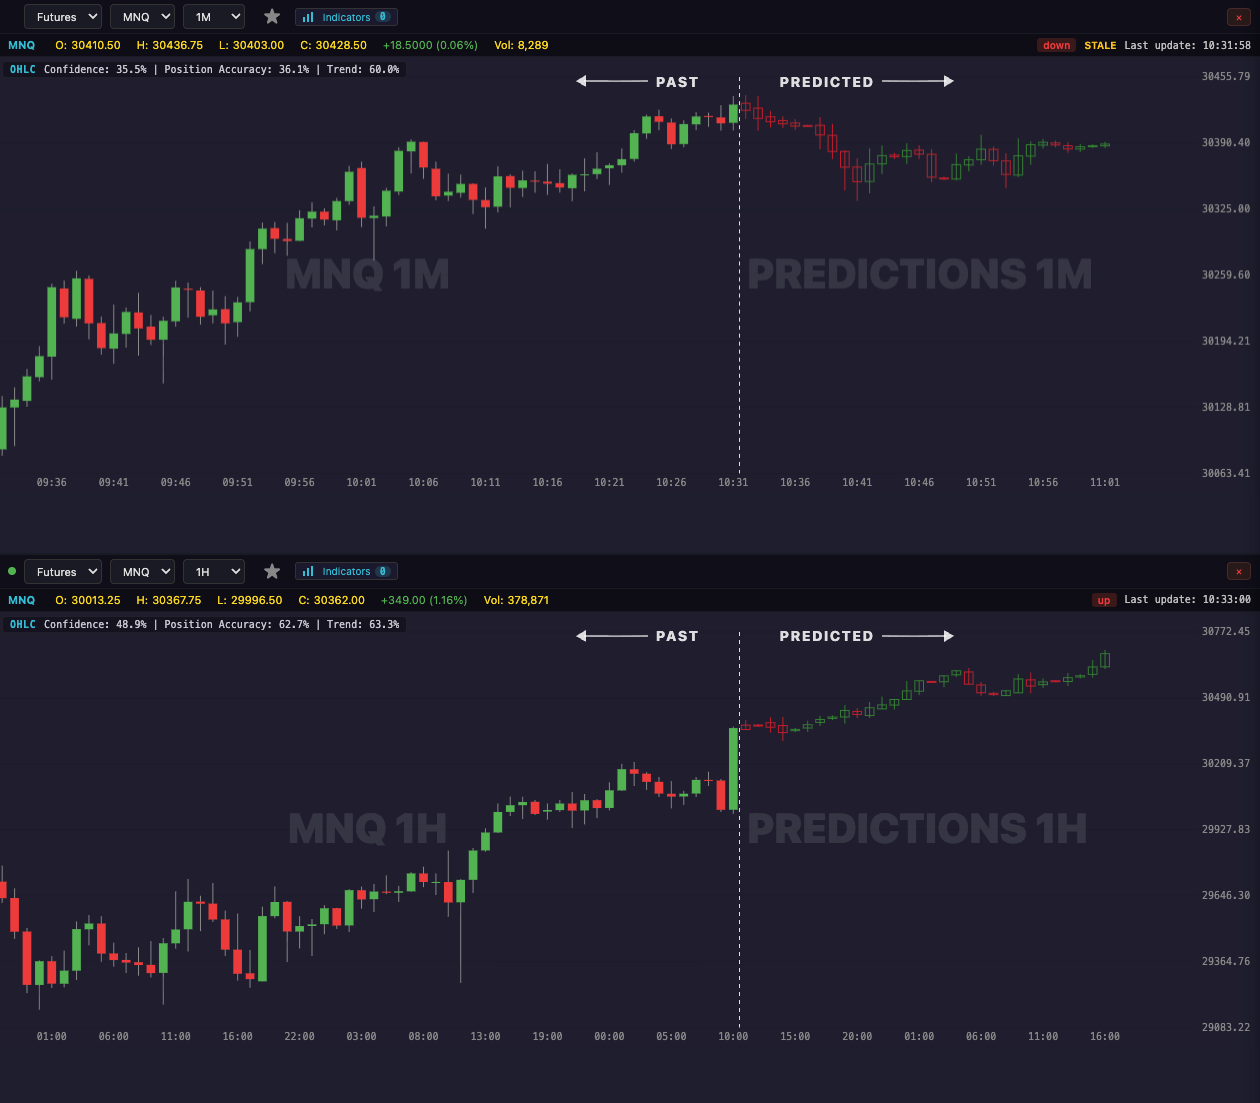
- MNQ 1 minute — busiest 10:00, 3.6× the quietest hour
- MNQ 5 minute — busiest 10:00, 3.6× the quietest hour
- MNQ 10 minute — busiest 10:00, 3.6× the quietest hour
- MNQ 15 minute — busiest 10:00, 4.1× the quietest hour
Micro E-mini Dow (MYM)
- MYM 1 minute — busiest 10:00, 8.0× the quietest hour
- MYM 5 minute — busiest 10:00, 6.2× the quietest hour
- MYM 10 minute — busiest 10:00, 6.2× the quietest hour
- MYM 15 minute — busiest 10:00, 6.3× the quietest hour
Natural Gas (NG)
- NG 1 minute — busiest 08:00, 0.0× the quietest hour
- NG 5 minute — busiest 08:00, 11.0× the quietest hour
- NG 10 minute — busiest 08:00, 8.0× the quietest hour
- NG 15 minute — busiest 08:00, 6.3× the quietest hour
E-mini Nasdaq 100 (NQ)
- NQ 1 minute — busiest 10:00, 3.9× the quietest hour
- NQ 5 minute — busiest 10:00, 3.5× the quietest hour
- NQ 10 minute — busiest 10:00, 3.8× the quietest hour
- NQ 15 minute — busiest 10:00, 4.1× the quietest hour
E-mini Russell 2000 (RTY)
- RTY 1 minute — busiest 10:00, 9.0× the quietest hour
- RTY 5 minute — busiest 10:00, 6.1× the quietest hour
- RTY 10 minute — busiest 10:00, 5.6× the quietest hour
- RTY 15 minute — busiest 10:00, 6.5× the quietest hour
Silver (SI)
- SI 1 minute — busiest 09:00, 5.0× the quietest hour
- SI 5 minute — busiest 09:00, 4.0× the quietest hour
- SI 10 minute — busiest 09:00, 3.5× the quietest hour
- SI 15 minute — busiest 09:00, 3.6× the quietest hour
Micro Silver (SIL)
- SIL 1 minute — busiest 09:00, 5.3× the quietest hour
- SIL 5 minute — busiest 09:00, 4.1× the quietest hour
- SIL 10 minute — busiest 09:00, 3.3× the quietest hour
- SIL 15 minute — busiest 09:00, 3.6× the quietest hour
SPDR S&P 500 ETF (SPY)
- SPY 1 minute — busiest 10:00, 12.3× the quietest hour
U.S. Dollar / Canadian Dollar (USDCAD)
- USDCAD 1 minute — busiest 10:00, 5.0× the quietest hour
- USDCAD 5 minute — busiest 10:00, 3.7× the quietest hour
E-mini Dow (YM)
- YM 1 minute — busiest 10:00, 11.5× the quietest hour
- YM 5 minute — busiest 10:00, 6.8× the quietest hour
- YM 10 minute — busiest 10:00, 6.6× the quietest hour
- YM 15 minute — busiest 10:00, 7.1× the quietest hour
10 Year T Note (ZN)
- ZN 1 minute — busiest 02:00, 0.0× the quietest hour
- ZN 5 minute — busiest 08:00, 3.0× the quietest hour
- ZN 10 minute — busiest 08:00, 4.0× the quietest hour
- ZN 15 minute — busiest 09:00, 5.0× the quietest hour