When Does NG Actually Move? Hourly Ranges on 10-minute Charts
Educational reference. Measured from 5,009 recorded 10-minute bars of Natural Gas through September 16, 2026.
08:00 is the busiest hour, averaging 0.0140 per bar — 7.0× the quietest hour at 19:00.
The same stop is a different stop at different times of day. This is the median high-to-low range of a single 10-minute bar of Natural Gas, hour by hour, measured from 5,009 recorded bars over the last 90 days.
| Hour (ET) | Median range | Bars | |
|---|---|---|---|
| 00:00 | 0.0030 | 218 | |
| 01:00 | 0.0030 | 216 | |
| 02:00 | 0.0060 | 218 | |
| 03:00 | 0.0070 | 217 | |
| 04:00 | 0.0060 | 216 | |
| 05:00 | 0.0050 | 219 | |
| 06:00 | 0.0060 | 219 | |
| 07:00 | 0.0100 | 220 | |
| 08:00 | 0.0140 | 218 | |
| 09:00 | 0.0130 | 222 | |
| 10:00 | 0.0110 | 220 | |
| 11:00 | 0.0090 | 220 | |
| 12:00 | 0.0080 | 217 | |
| 13:00 | 0.0070 | 221 | |
| 14:00 | 0.0090 | 218 | |
| 15:00 | 0.0050 | 210 | |
| 16:00 | 0.0040 | 209 | |
| 18:00 | 0.0030 | 184 | |
| 19:00 | 0.0020 | 216 | |
| 20:00 | 0.0040 | 217 | |
| 21:00 | 0.0030 | 222 | |
| 22:00 | 0.0030 | 221 | |
| 23:00 | 0.0030 | 215 |
The spread across the day
The busiest hour is 08:00, averaging 0.0140 per bar. The quietest is 19:00 at 0.0020. That is a 7.0× difference across the same instrument, the same timeframe, the same trading day.
A stop sized for 19:00 conditions will be caught routinely at 08:00, and a stop sized for 08:00 gives away far more than it needs to overnight. The same number of points does not mean the same thing at every hour.
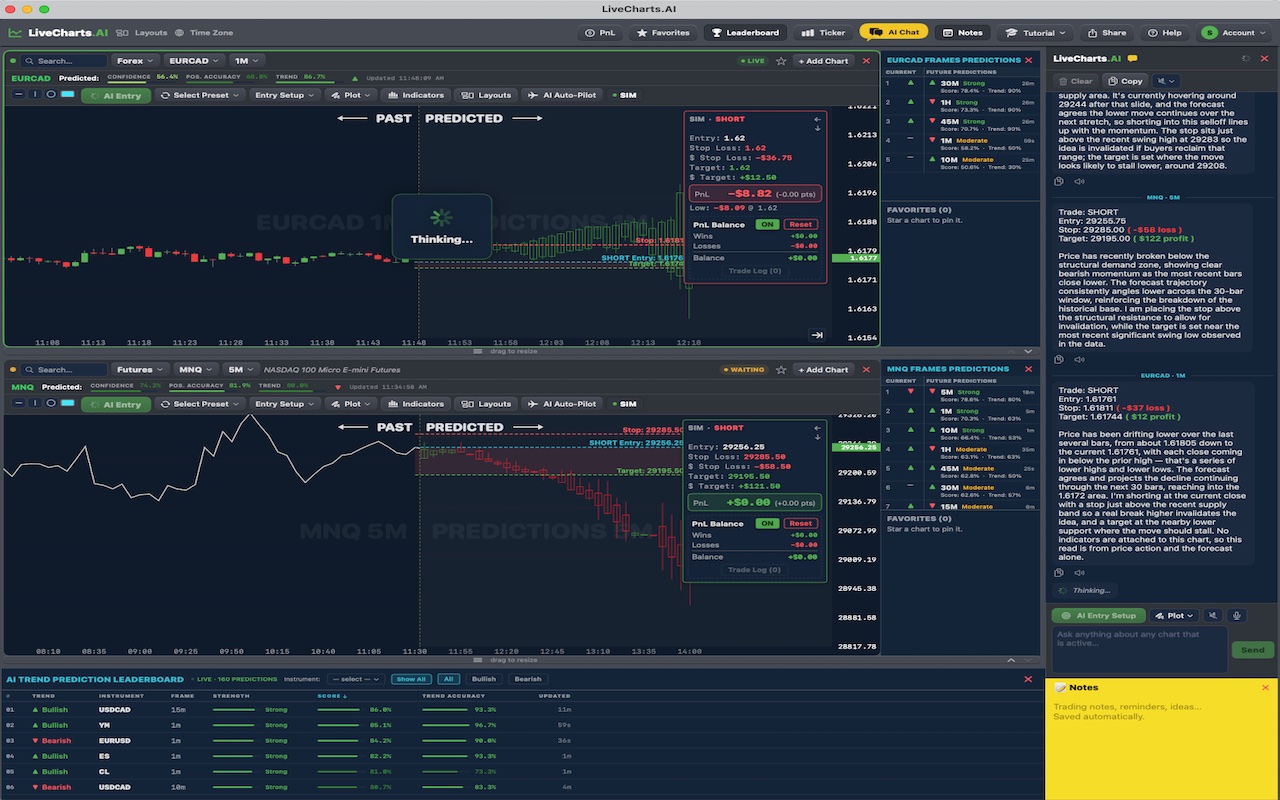
See LiveCharts.AI forecasting Natural Gas live — 7-day free trial →
How this was measured
Every 10-minute bar of Natural Gas recorded in the last 90 days was grouped by the hour it opened, in Eastern time. The figure shown is the median of high minus low within each group — the middle bar of that hour, not the average, so a single outlier session cannot distort it. Hours with fewer than 60 recorded bars are omitted rather than shown on thin evidence.
These are recorded market ranges, not forecasts. Nothing on this page is a projection.