AI chart analysis
LiveCharts.AI is AI technical analysis on a live chart. Pick a market and a timeframe and the chart shows where the price has been, the predicted next 30 bars, and the predicted path of the indicators traders already use — MACD, RSI, Stochastics, ATR and more. Then ask the AI about what you see.
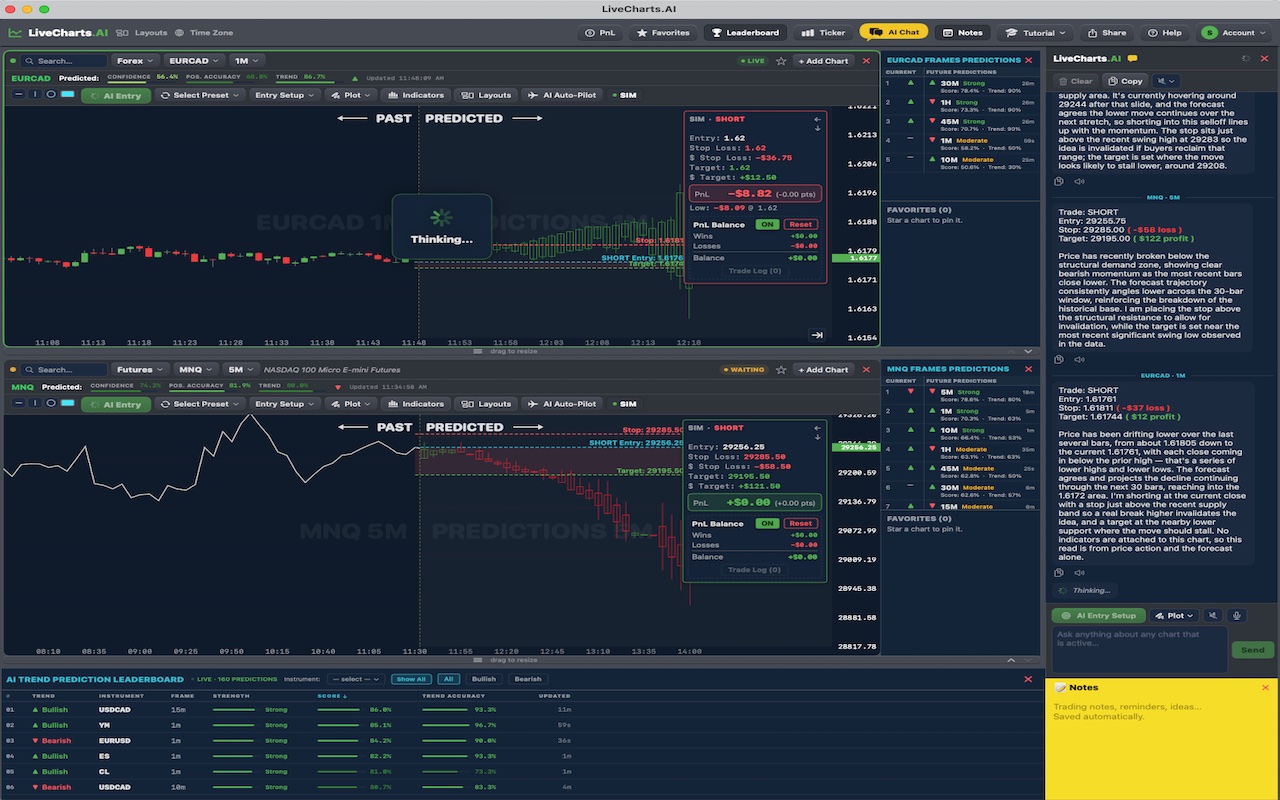
What the AI chart analysis shows
The predicted price path. The next 30 bars on every timeframe from 1 minute to 1 hour, drawn on the chart beside the real bars, with a confidence score.
Predicted indicators. The same prediction for 21 indicators, so you can see where MACD or RSI is predicted to go, not only where it has been. See the predicted indicators.
An AI that reads the chart. Ask a question about the chart on your screen and get a written answer in place. How the chart chat works.
A recent prediction compared with what happened
Made Oct 8, 6:20 AM ET with CL at 91.89, the prediction said CL would be higher 2 hours later (92.14). CL was at 92.52 — the direction the prediction called.
How often the direction was right
| Market | Direction right | Micro contract | Chart |
|---|---|---|---|
| Oil futures (CL, MCL) | 64% | 64% | 10 minute chart, 2 hours ahead |
| Natural gas futures (NG, MNG) | 63% | 63% | 30 minute chart, 6 hours ahead |
| Nasdaq futures (NQ, MNQ) | 63% | 64% | 10 minute chart, 2 hours ahead |
| Dow futures (YM, MYM) | 62% | 62% | 1 minute chart, 12 minutes ahead |
| S&P 500 futures (ES, MES) | 62% | 61% | 15 minute chart, 3 hours ahead |
| Gold futures (GC, MGC) | 56% | 54% | 15 minute chart, 30 minutes ahead |
| Silver futures (SI, SIL) | 55% | 56% | 10 minute chart, 2 hours ahead |
Based on LiveCharts.AI's recorded predictions compared with what the market actually did.
Open LiveCharts.AI →More: Candlestick prediction · Can AI predict futures prices? · Futures markets