Candlestick prediction
A candlestick chart shows what already happened. LiveCharts.AI adds what is predicted to happen next: the next 30 candles of the market you are watching, on every timeframe from 1 minute to 1 hour, drawn on the same chart.
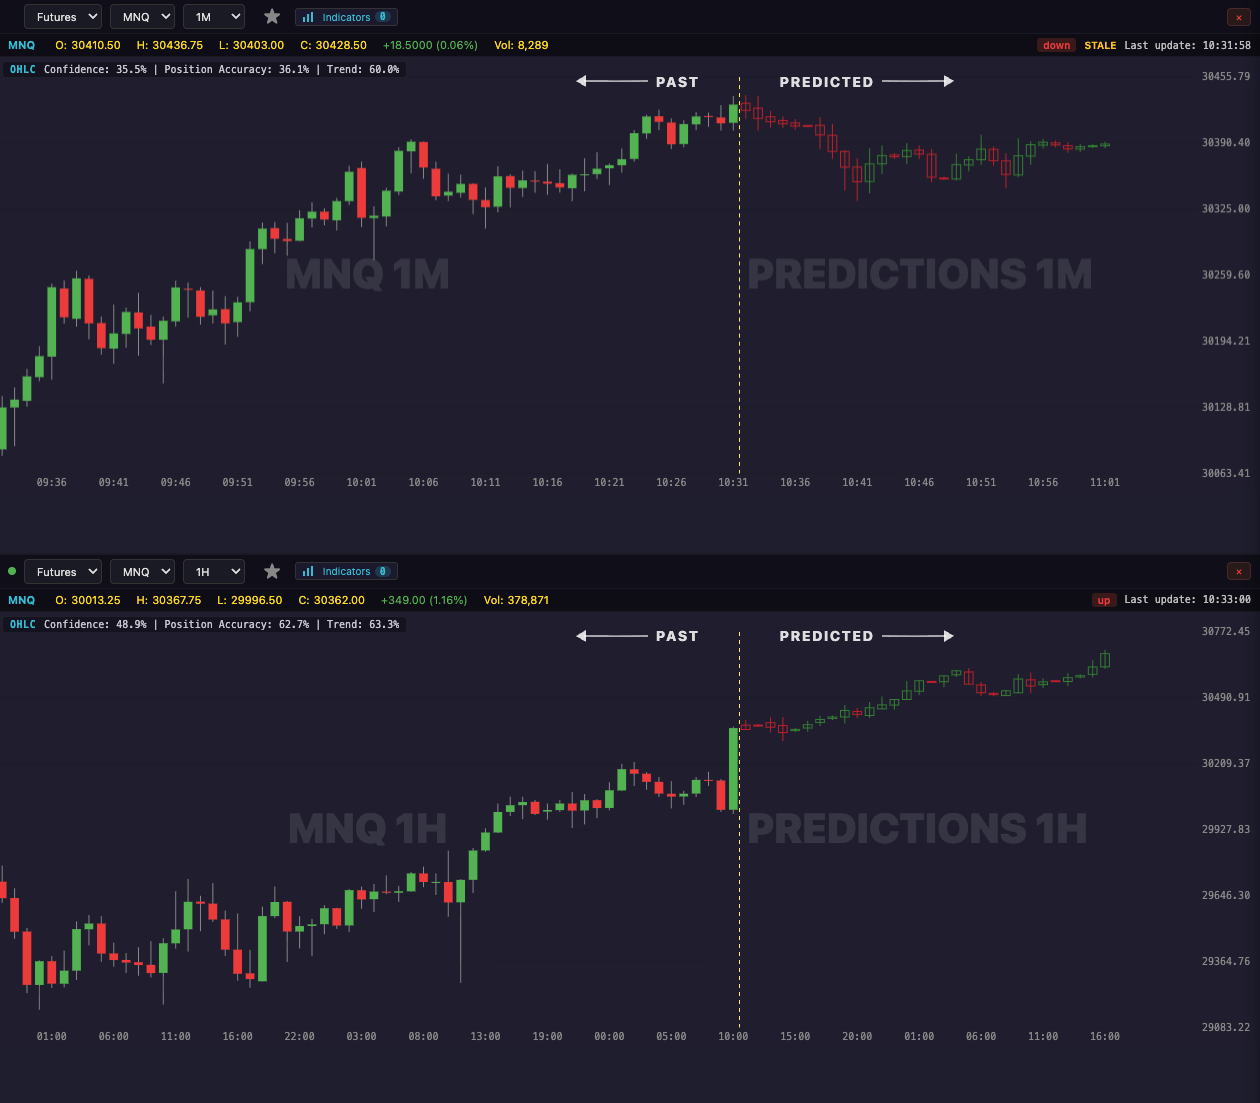
How to read the predicted candles
Real candles stay on the left; the predicted path continues to the right of the latest bar. On a 5 minute chart 30 candles reach about two and a half hours ahead; on the 1 hour chart they reach through the next session. The prediction updates as each new candle closes, so it always starts from the latest price.
A recent CL prediction compared with what happened
Made Oct 8, 6:20 AM ET with CL at 91.89, the prediction said CL would be higher 2 hours later (92.14). CL was at 92.52 — the direction the prediction called.
How often the direction was right
| Market | Direction right | Micro contract | Chart |
|---|---|---|---|
| Oil futures (CL, MCL) | 64% | 64% | 10 minute chart, 2 hours ahead |
| Natural gas futures (NG, MNG) | 63% | 63% | 30 minute chart, 6 hours ahead |
| Nasdaq futures (NQ, MNQ) | 63% | 64% | 10 minute chart, 2 hours ahead |
| Dow futures (YM, MYM) | 62% | 62% | 1 minute chart, 12 minutes ahead |
| S&P 500 futures (ES, MES) | 62% | 61% | 15 minute chart, 3 hours ahead |
| Gold futures (GC, MGC) | 56% | 54% | 15 minute chart, 30 minutes ahead |
| Silver futures (SI, SIL) | 55% | 56% | 10 minute chart, 2 hours ahead |
Based on LiveCharts.AI's recorded predictions compared with what the market actually did.
🔒 Today's predicted candles
The live predicted candles for every market and timeframe are in the app.
See the predicted candles →More: AI chart analysis · Predictive indicators · Futures markets