LiveCharts.AI › Predictive indicators
Predictive indicators
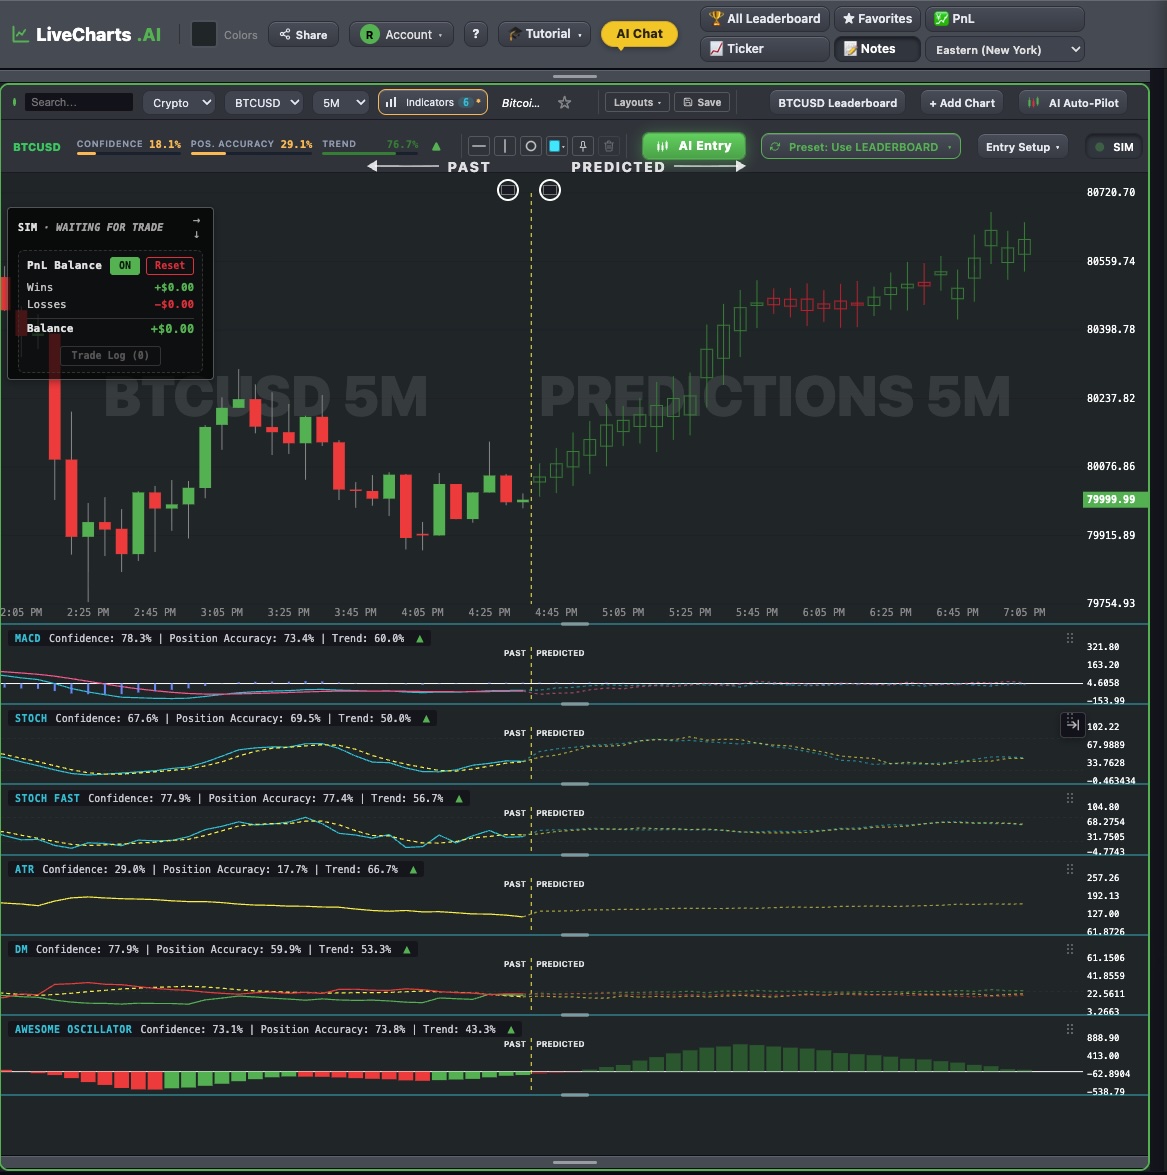
Classic indicators are calculated from bars that already closed, so they always arrive after the move. LiveCharts.AI adds a price prediction indicator for each of them: the predicted path of the indicator itself, drawn beside its real values on every timeframe.
What predictive technical analysis adds
See a MACD cross or an RSI turn that is predicted, not only one that already happened. Use the predicted ATR to judge how much the market may move, or the predicted ADX to judge whether a trend is getting stronger or quieter.
Indicators with a prediction
- MACD prediction
- RSI prediction
- Stochastics prediction
- Fast Stochastics prediction
- CCI prediction
- Williams %R prediction
- ADX / DMI prediction
- Awesome Oscillator prediction
- Momentum prediction
- ATR prediction
- Standard Deviation prediction
- EMA prediction
- SMA prediction
- VWMA prediction
- Bollinger Bands prediction
- Keltner Channels prediction
- MAMA prediction
- Parabolic SAR prediction
- Ichimoku Cloud prediction
- Wiseman Alligator prediction
- Price Action Oscillator prediction
Each page shows how that indicator's recent predictions compared with what it actually did.
See the predicted indicators →Educational: a prediction is an estimate of a possible path, not a certainty. Compare it with what happened before relying on it.
More: AI chart analysis · Candlestick prediction · Indicator predictions by market
LiveCharts.AI disclaimer: trading involves risk of substantial loss and is not suitable for every investor. LiveCharts.AI provides technical analysis tools and predictions for educational and informational purposes only; outcomes vary and individual results may differ from any examples shown. Historical performance is not indicative of future outcomes. Only invest capital you can afford to lose and consult a licensed financial advisor before making investment decisions.