LiveCharts.AI › Indicators › Bollinger
How accurate are Bollinger predictions?
Bollinger Measured across 107 qualifying charts.
| Timeframe | Median directional | Best | Charts |
|---|---|---|---|
| 1-Minute | 98.0% | 98.0% | 16 |
| 5-Minute | 98.0% | 98.0% | 17 |
| 10-Minute | 98.0% | 98.0% | 17 |
| 15-Minute | 98.0% | 98.0% | 17 |
| 30-Minute | 98.0% | 98.0% | 10 |
| 45-Minute | 93.3% | 98.0% | 13 |
| 1-Hour | 93.3% | 98.0% | 17 |
Median and best directional accuracy. “Charts” is how many qualifying charts fed each row — the sample size behind the median, not a page count. Measured, not estimated.
Across every qualifying chart the median directional accuracy for Bollinger is 98.0%. Accuracy varies more by timeframe than by instrument.
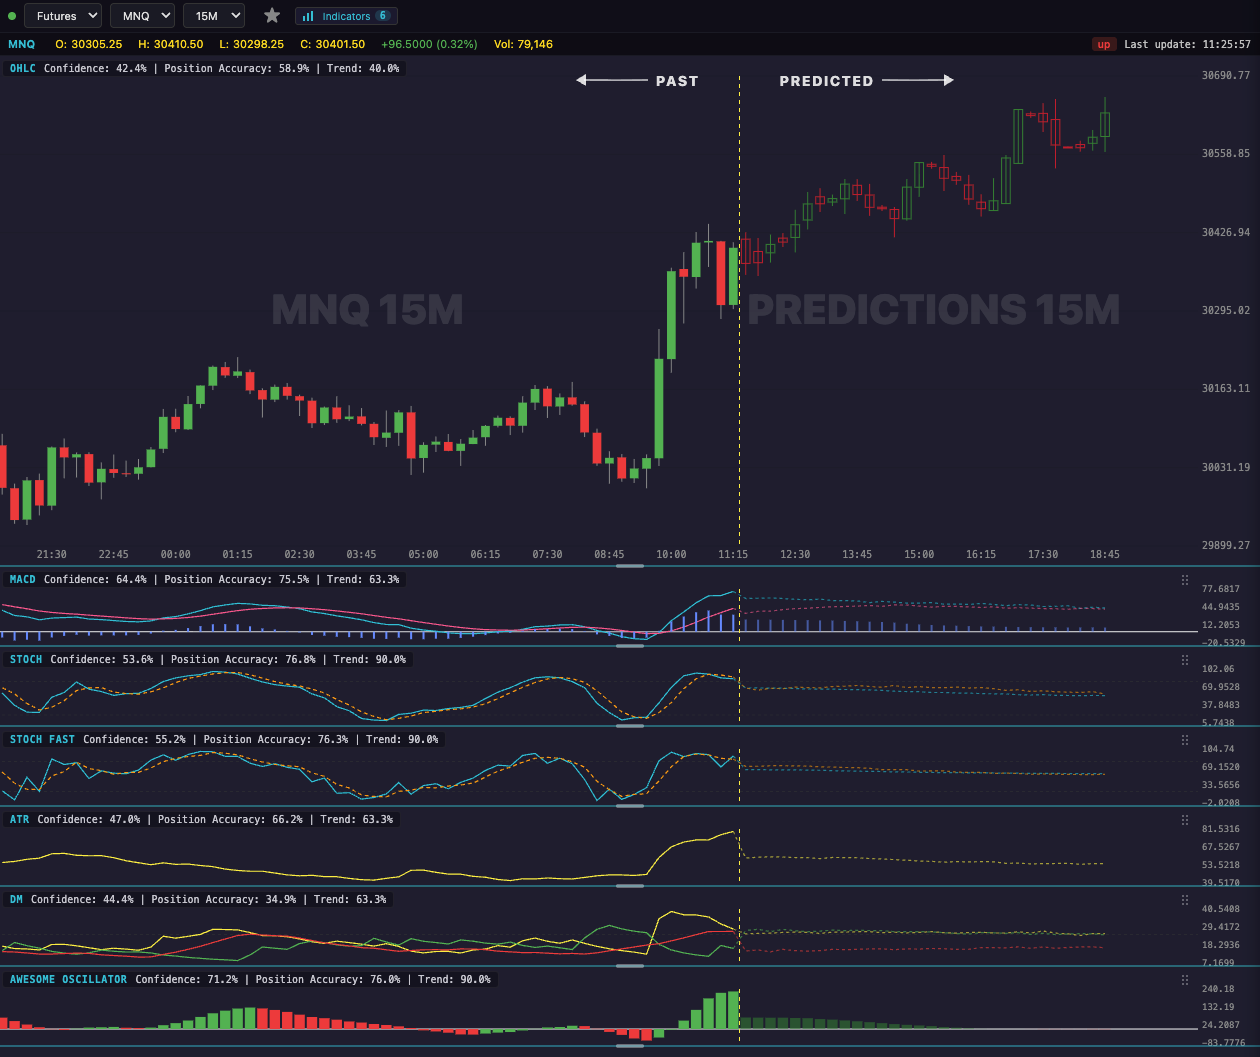
What these numbers are
Directional accuracy is how often the projected direction proved correct, measured against what price actually did. It is not a claim about future performance. The predictions themselves are produced inside the platform.
See the live predictions — 7-day free trialSee live predictions on LiveCharts.AI →
LiveCharts.AI disclaimer: trading involves risk of substantial loss and is not suitable for every investor. LiveCharts.AI provides technical analysis tools and AI-generated predictions for educational and informational purposes only; outcomes vary and individual results may differ from any examples shown. Historical performance is not indicative of future outcomes. Only invest capital you can afford to lose and consult a licensed financial advisor before making investment decisions.