Nasdaq Futures (NQ, MNQ) — Live Chart & Prediction
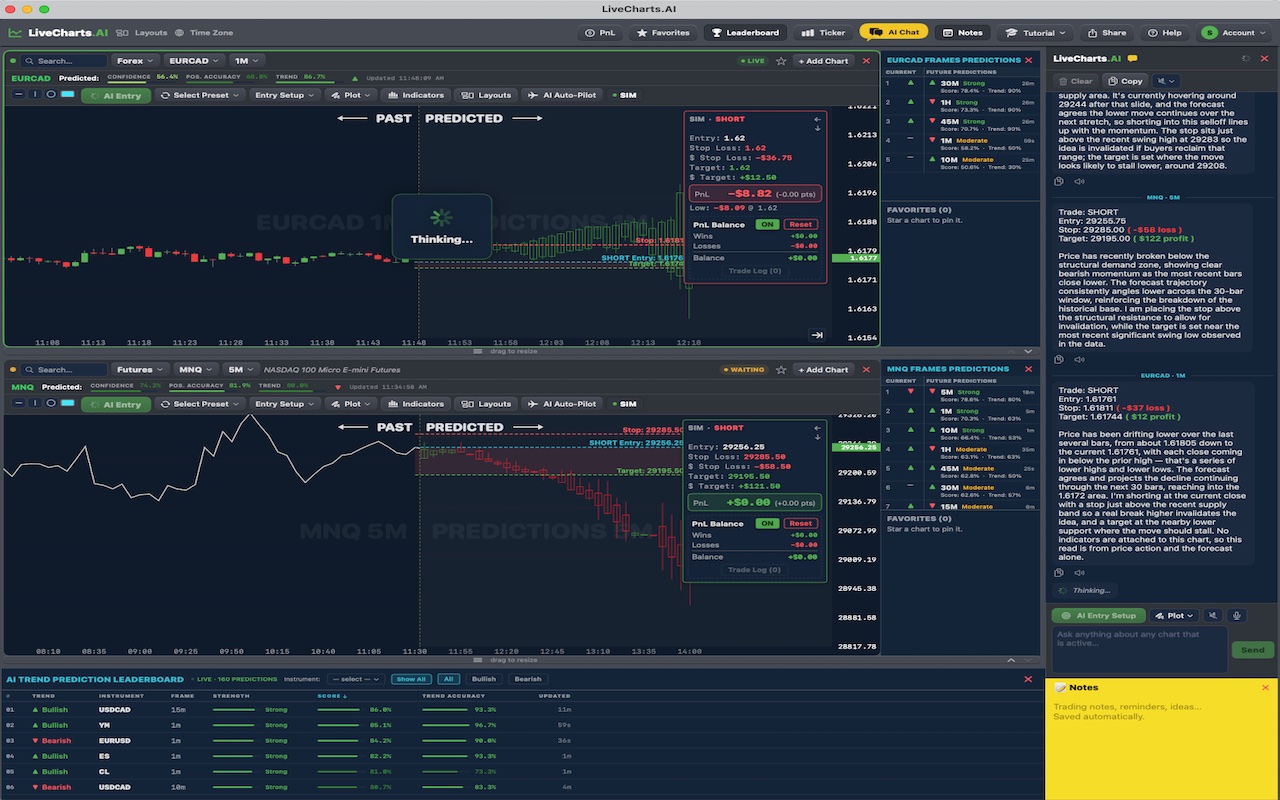
Nasdaq-100 futures — NQ (E-mini) and MNQ (Micro E-mini, one tenth the size) — on a live chart, with LiveCharts.AI's prediction of where the price goes next on every timeframe, from 1 minute to 1 hour.
Nasdaq futures live chart
Updated Oct 6, 10:37 PM ET. Open the live chart with every timeframe and the prediction drawn on it:
Open the live Nasdaq futures chart →Nasdaq futures prediction for today and tomorrow
🔒 Where Nasdaq futures are predicted to go next
LiveCharts.AI predicts the next 30 bars of NQ and MNQ on every timeframe. On the 1-hour chart that reaches about 30 trading hours ahead — through tomorrow's session; on the 15-minute chart it covers the rest of today. The live prediction, its confidence and its direction are in the app.
See today's and tomorrow's Nasdaq futures prediction →A recent 10-minute NQ prediction vs what actually happened
Made Oct 6, 3:20 PM ET with NQ at 31,524, the prediction said NQ would be lower 2 hours later (31,476). NQ was at 31,517 — the direction the prediction called.
How often the Nasdaq futures prediction gets the direction right
Measured on predictions whose whole path has already happened: was the price 2 hours later above or below where it was when the prediction was made, and did the prediction say the same. Re-measured every day.
Questions traders ask about Nasdaq futures
Where will Nasdaq futures be tomorrow? Nobody knows for certain. LiveCharts.AI's 1-hour prediction shows the path it predicts through tomorrow's session, with a confidence score — and this page shows how recent predictions compared with what actually happened.
NQ or MNQ? Both follow the same market; LiveCharts.AI predicts each on every timeframe.
More: NQ prediction accuracy by timeframe · MNQ · NQ prediction vs actual, every day · Nasdaq futures indicator predictions · All markets