Can AI predict futures prices?
Not with certainty — no one can. What an AI can do is estimate the most likely path from what the market has done, and be measured honestly against what happened next. That record is the only fair answer to "how accurate are AI trading predictions?".
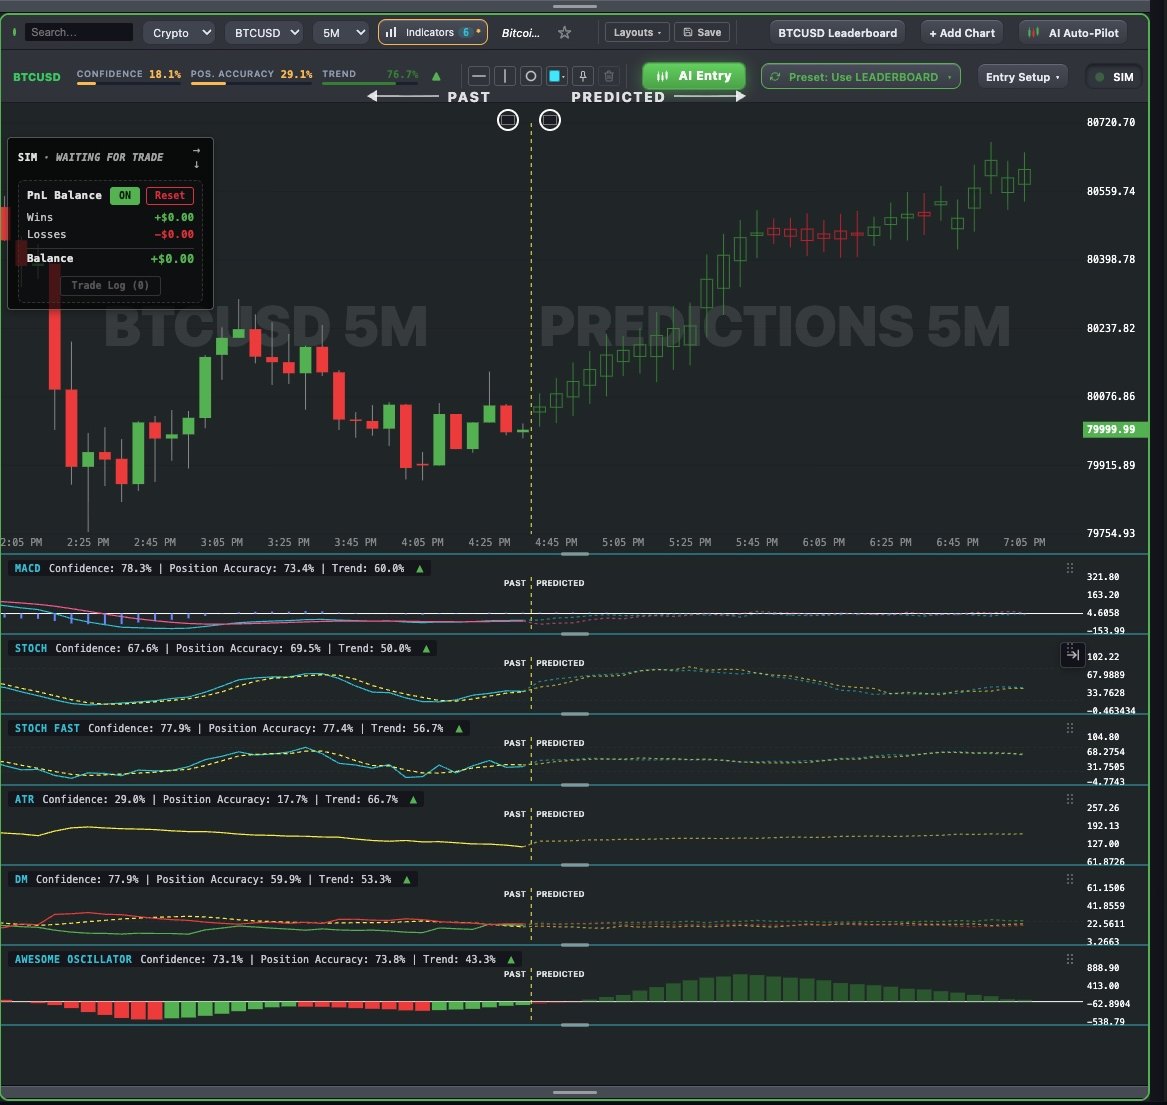
How accurate are AI trading predictions?
For the futures markets below, LiveCharts.AI's predictions called the direction between 55% and 64% of the time on their best chart — on both the full size and the micro contract.
| Market | Direction right | Micro contract | Chart |
|---|---|---|---|
| Oil futures (CL, MCL) | 64% | 64% | 10 minute chart, 2 hours ahead |
| Natural gas futures (NG, MNG) | 63% | 63% | 30 minute chart, 6 hours ahead |
| Nasdaq futures (NQ, MNQ) | 63% | 64% | 10 minute chart, 2 hours ahead |
| Dow futures (YM, MYM) | 62% | 62% | 1 minute chart, 12 minutes ahead |
| S&P 500 futures (ES, MES) | 62% | 61% | 15 minute chart, 3 hours ahead |
| Gold futures (GC, MGC) | 56% | 54% | 15 minute chart, 30 minutes ahead |
| Silver futures (SI, SIL) | 55% | 56% | 10 minute chart, 2 hours ahead |
Based on LiveCharts.AI's recorded predictions compared with what the market actually did.
What that means
No record is a guarantee: a market whose direction is called right 60% of the time is still called wrong 4 times in 10. Treat a prediction as one input, compare it with what happens, and plan for it being wrong.
See today's predictions in the app →More: Futures markets · AI chart analysis · Candlestick prediction