Does Relative Strength Index Agree on GBPUSD and ZN? (10-minute Charts)
Educational reference. Measured from recorded market data through September 12, 2026. Not a forecast.
Relative Strength Index measures where price sits within its own recent gains and losses. This page asks a narrower question than the price comparison: when Relative Strength Index moves on British Pound / U.S. Dollar, does it move the same way on 10-Year T-Note?
| Bars where Relative Strength Index moved on both | 2,217 |
|---|---|
| … and moved the same direction | 1,268 (57.2%) |
| Price correlation, same period | +0.406 |
Why this is not the same as the price question
Two markets can move together while their momentum, trend strength or volatility do not. A reading that agrees far less than price suggests is exactly where one market is losing steam while the other keeps going — and a reading that agrees more is tracking something shared that direction alone does not capture.
See LiveCharts.AI forecasting Relative Strength Index on both — 7-day free trial →
See the price relationship between GBPUSD and ZN →
See live predictions on LiveCharts.AI →
Questions traders ask
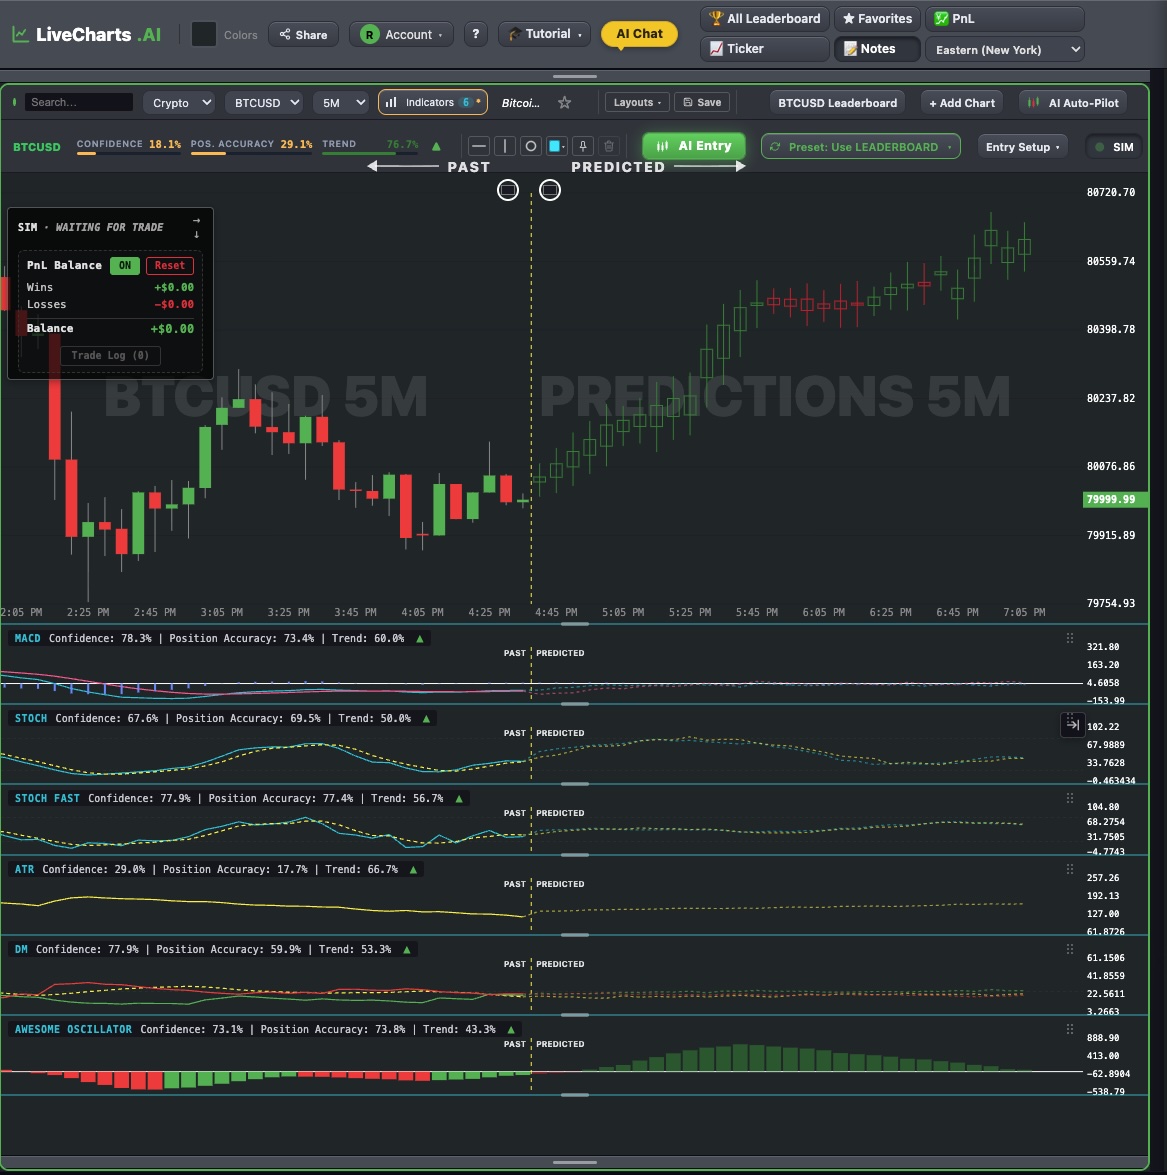
RSI direction prediction for GBPUSD Yes. Alongside the regular RSI, LiveCharts.AI draws the predicted RSI for GBPUSD on every timeframe from 1 minute to 1 hour, updated as each candle closes. Predictive indicators →
AI chart consolidation analysis for GBPUSD Yes. LiveCharts.AI reads the live GBPUSD chart, draws where the price and the indicators are predicted to go next, and its AI chat explains what the chart is showing in plain language. AI chart analysis →
Real time charting assistant GBPUSD LiveCharts.AI updates the GBPUSD prediction as each candle closes, so the predicted path always starts from the latest price, and the chat answers questions about the chart as it is now. AI chart analysis →
More questions traders ask
1 USD GBP For GBPUSD, LiveCharts.AI draws predicted candlesticks and indicators to the right of the live price, and its AI chat answers questions about the GBPUSD chart. Predictions are estimates, not certainties. GBPUSD predictions →
GBPUSD signals forex GBPUSD (GBPUSD) is live on LiveCharts.AI with the next 30 bars predicted on every timeframe from 1 minute to 1 hour, redrawn as each candle closes. A prediction is an estimate, not a certainty; the market page shows recent GBPUSD predictions next to what happened. GBPUSD predictions →
GBPUSD trading signals Open the GBPUSD chart on LiveCharts.AI to see where GBPUSD is now and where its next 30 candles are predicted to go. Past GBPUSD predictions are published next to what the market actually did. GBPUSD predictions →