Does Average True Range Agree on GBPUSD and MGC? (5-minute Charts)
Educational reference. Measured from recorded market data through October 4, 2026. Not a prediction.
Average True Range measures how much ground a bar covers — volatility, not direction. This page asks a narrower question than the price comparison: when Average True Range moves on British Pound / U.S. Dollar, does it move the same way on Micro Gold?
| Bars where Average True Range moved on both | 1,644 |
|---|---|
| … and moved the same direction | 1,032 (62.8%) |
| Price correlation, same period | +0.408 |
Why this is not the same as the price question
Two markets can move together while their momentum, trend strength or volatility do not. A reading that agrees far less than price suggests is exactly where one market is losing steam while the other keeps going — and a reading that agrees more is tracking something shared that direction alone does not capture.
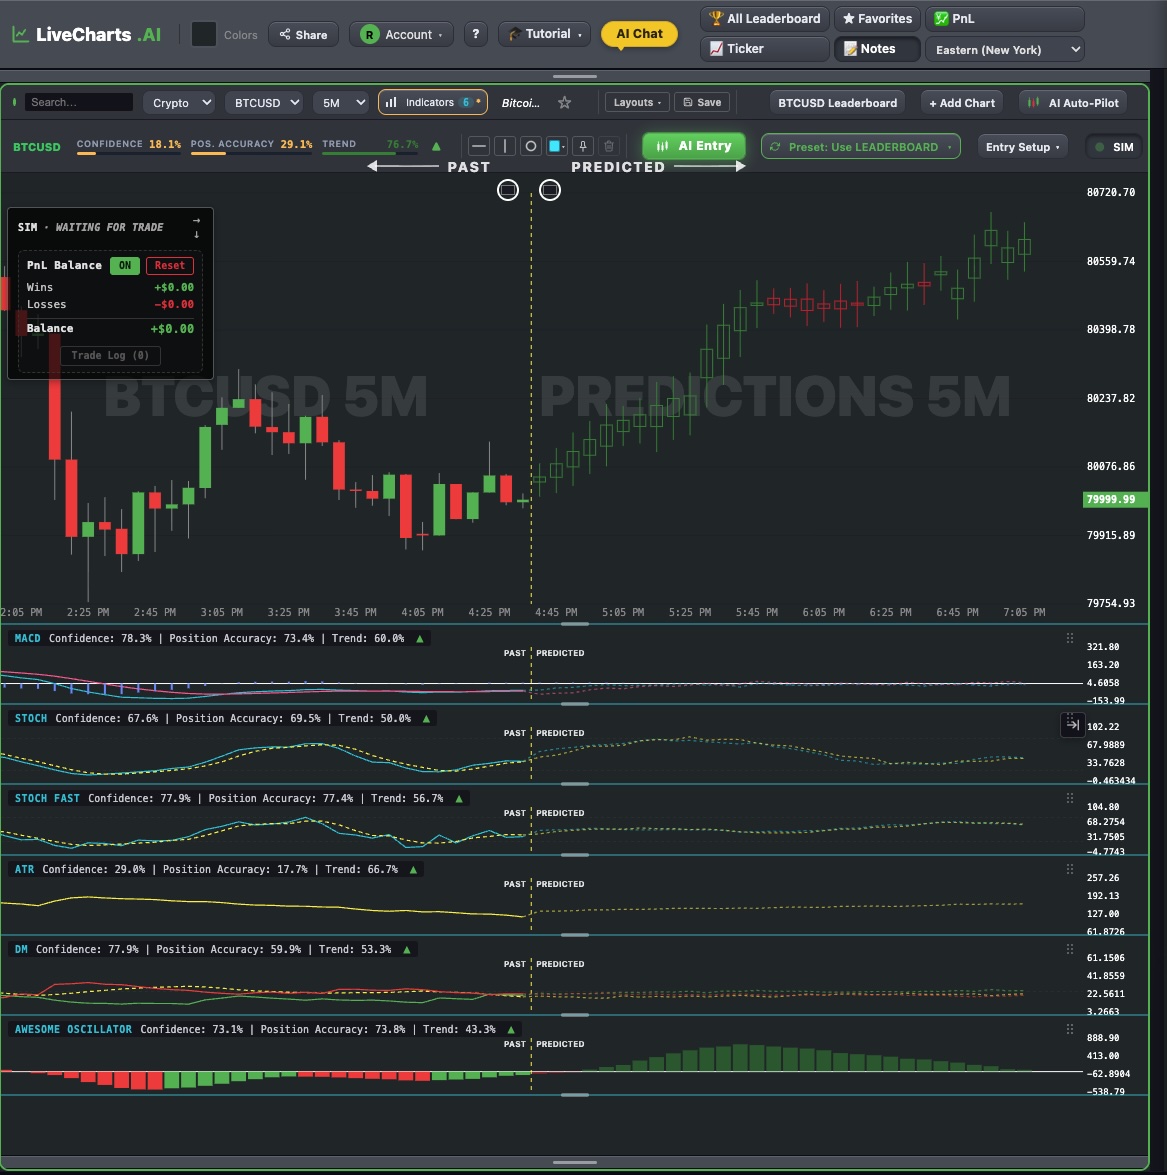
See LiveCharts.AI predicting Average True Range on both — 7-day free trial →
See the price relationship between GBPUSD and MGC →
See live predictions on LiveCharts.AI →
Questions traders ask
ATR prediction for next candle Yes. Alongside the regular ATR, LiveCharts.AI draws the predicted ATR for GBPUSD on every timeframe from 1 minute to 1 hour, updated as each candle closes. Predictive indicators →
Can I ask an AI chatbot about the GBPUSD chart? Yes. In LiveCharts.AI you chat with the live GBPUSD chart: ask what the predicted candles imply or where the predicted indicators turn, and the answer is about the chart in front of you. Chat with a trading chart →
GBPUSD prediction next hours LiveCharts.AI predicts the GBPUSD path for the rest of today and tomorrow on every timeframe. It is a prediction, not a certainty; the market page shows how recent ones turned out. Market prediction page →