Does Awesome Oscillator Agree on ES (S&P 500 E-mini Futures) and MBT (Micro Bitcoin Futures)? (5 minute Charts)
Educational reference. Measured from recorded market data through November 3, 2026. Not a prediction.
Awesome Oscillator measures momentum, as the gap between two averages of bar midpoints. This page asks a narrower question than the price comparison: when Awesome Oscillator moves on E-mini S&P 500, does it move the same way on Micro Bitcoin?
| Bars where Awesome Oscillator moved on both | 8,064 |
|---|---|
| … and moved the same direction | 5,097 (63.2%) |
| Price correlation, same period | +0.408 |
Why this is not the same as the price question
Two markets can move together while their momentum, trend strength or volatility do not. A reading that agrees far less than price suggests is exactly where one market is losing steam while the other keeps going — and a reading that agrees more is tracking something shared that direction alone does not capture.
See LiveCharts.AI predicting Awesome Oscillator on both — 7 day free trial →
See the price relationship between ES and MBT →
See live predictions on LiveCharts.AI →
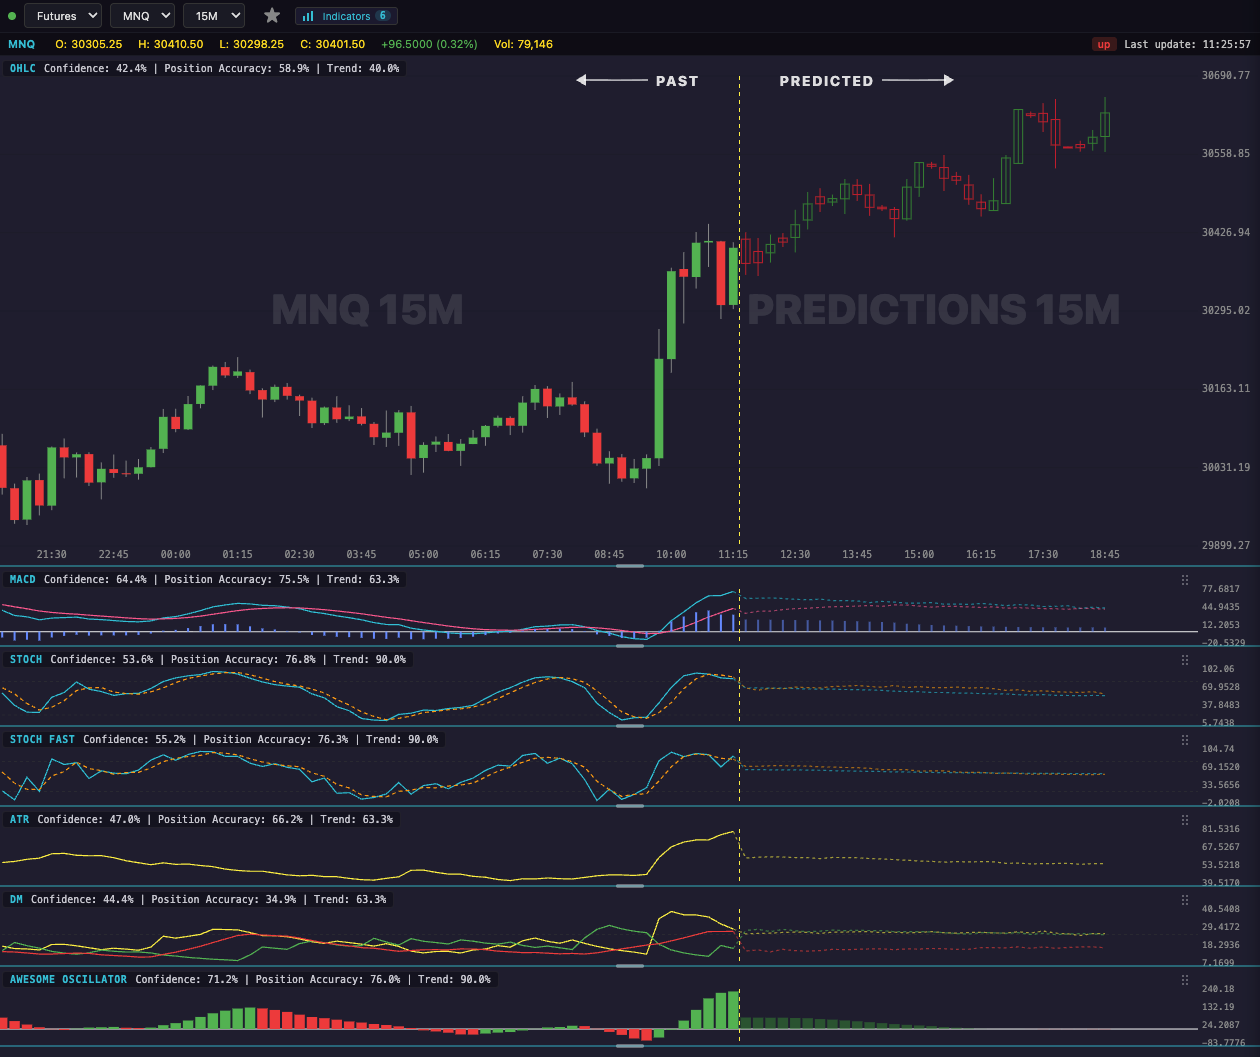
See LiveCharts.AI in action — predicted candlesticks and indicators, 30 bars into the future, before they occur:
Questions traders ask
S&P 500 E-mini Futures predict the next 5 minute candle Yes. LiveCharts.AI predicts ES on the 5 minute chart as on every timeframe from 1 minute to 1 hour, with the predicted indicators beside the predicted candles. Candlestick prediction →
ES future candle visualization app LiveCharts.AI is an AI charting and prediction app built for futures day traders: live ES charts, predicted candles up to 30 bars ahead and an AI chat that explains the chart, on web, iPhone, iPad and Mac. Futures prediction app →
Is there an AI that predicts the next ES candles? Yes. LiveCharts.AI draws the predicted next candles of ES to the right of the last bar, with their open, high, low and close, and redraws them as each candle closes. Predictions are estimates, not certainties. Candlestick prediction →
More questions traders ask
US stock futures cnn For S&P 500 E-mini Futures, LiveCharts.AI draws predicted candlesticks and indicators to the right of the live price, and its AI chat answers questions about the ES chart. Predictions are estimates, not certainties. S&P 500 E-mini Futures predictions →
S&P 500 ETF SPY LiveCharts.AI predicts the path of S&P 500 E-mini Futures (ES) 30 bars ahead on every timeframe and shows how recent predictions compared with what happened, so the record can be checked before relying on one. S&P 500 E-mini Futures predictions →
SPY historical data S&P 500 E-mini Futures (ES) is live on LiveCharts.AI with the next 30 bars predicted on every timeframe from 1 minute to 1 hour, redrawn as each candle closes. A prediction is an estimate, not a certainty; the market page shows recent ES predictions next to what happened. S&P 500 E-mini Futures predictions →