MNG RSI: which timeframe is most reliable?
Micro Natural Gas — RSI forecast accuracy on each timeframe, measured.
| Timeframe | Confidence | Position | Directional |
|---|---|---|---|
| 1-Minute | 53.5% | 70.7% | 96.7% |
| 5-Minute | 52.2% | 68.0% | 96.7% |
| 15-Minute | 55.0% | 70.8% | 96.7% |
| 30-Minute | 54.0% | 68.0% | 98.0% |
| 45-Minute | 50.1% | 63.9% | 96.7% |
| 1-Hour | 55.2% | 69.6% | 96.7% |
Measured outcomes, refreshed through the session.
On directional accuracy the strongest of these is 30-Minute at 98.0%. A slower frame usually sets context while a faster one decides timing, so the most accurate frame is not always the one to trade.
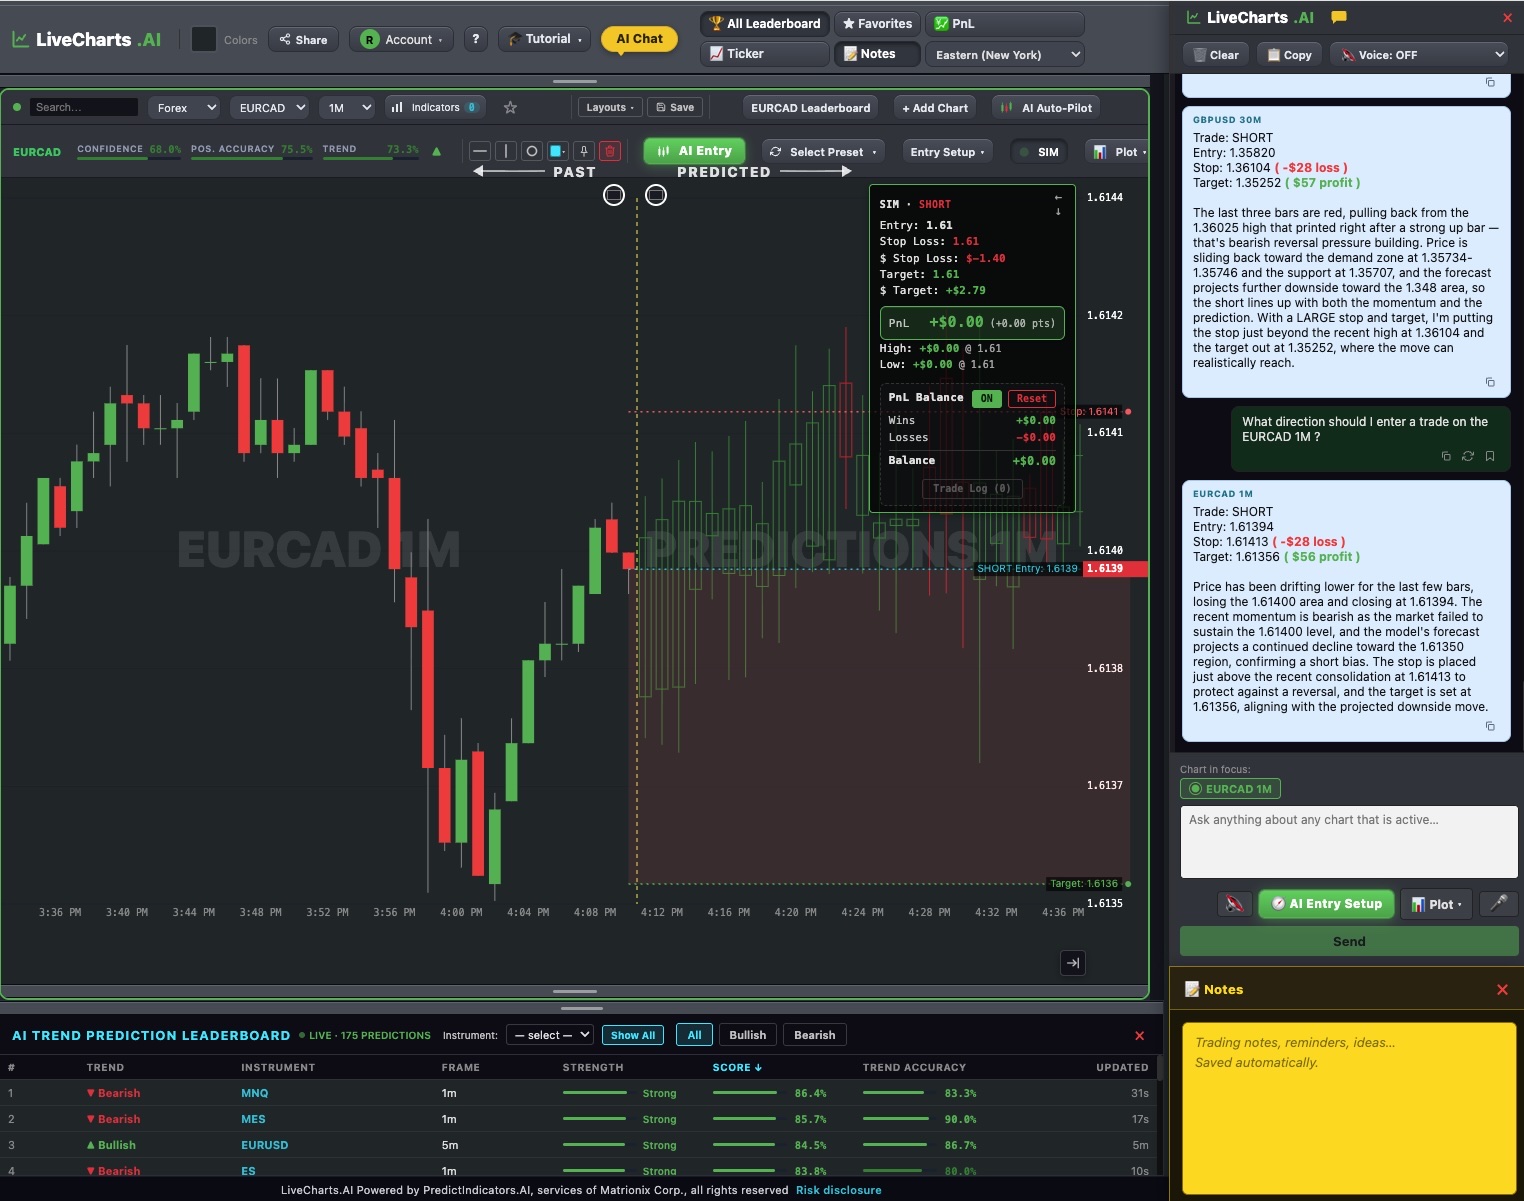
How to read this
Directional accuracy is how often the projected direction proved right; position accuracy is how closely the projected path tracked what actually happened. Confidence is LiveCharts.AI's own read. The live forecast itself is generated inside the platform.
See the live forecasts — 7-day free trialSee live predictions on LiveCharts.AI →
LiveCharts.AI disclaimer: trading involves risk of substantial loss and is not suitable for every investor. LiveCharts.AI provides technical analysis tools and AI-generated forecasts for educational and informational purposes only; outcomes vary and individual results may differ from any examples shown. Historical performance is not indicative of future outcomes. Only invest capital you can afford to lose and consult a licensed financial advisor before making investment decisions.