MES (Micro S&P 500 Futures) ATR: which timeframe is most reliable?
Micro E-mini S&P 500 — ATR prediction accuracy on each timeframe, measured.
| Timeframe | Confidence | Position | Directional |
|---|---|---|---|
| 1 Minute | 62.2% | 69.9% | 90.0% |
| 5 Minute | 63.3% | 69.4% | 46.7% |
| 10 Minute | 61.4% | 60.3% | 96.7% |
| 15 Minute | 53.4% | 66.5% | 96.7% |
| 30 Minute | 51.7% | 44.4% | 66.7% |
| 1 Hour | 49.9% | 64.6% | 98.0% |
Track record: does the ATR prediction call the direction?
| Measured on | Direction right | vs a simple guess | Predictions |
|---|---|---|---|
| 1 hour chart, 12 hours ahead | 65% | +23% | 271 |
A recent finished prediction: made Oct 14, 7:00 AM ET with MES's ATR at 9.35, it said higher 12 hours later (11.87); it was at 17.50 — the direction the prediction called.
Based on LiveCharts.AI's recorded predictions compared with what the market actually did.
On directional accuracy the strongest of these is 1 Hour at 98.0%. A slower frame usually sets context while a faster one decides timing, so the most accurate frame is not always the one to trade.
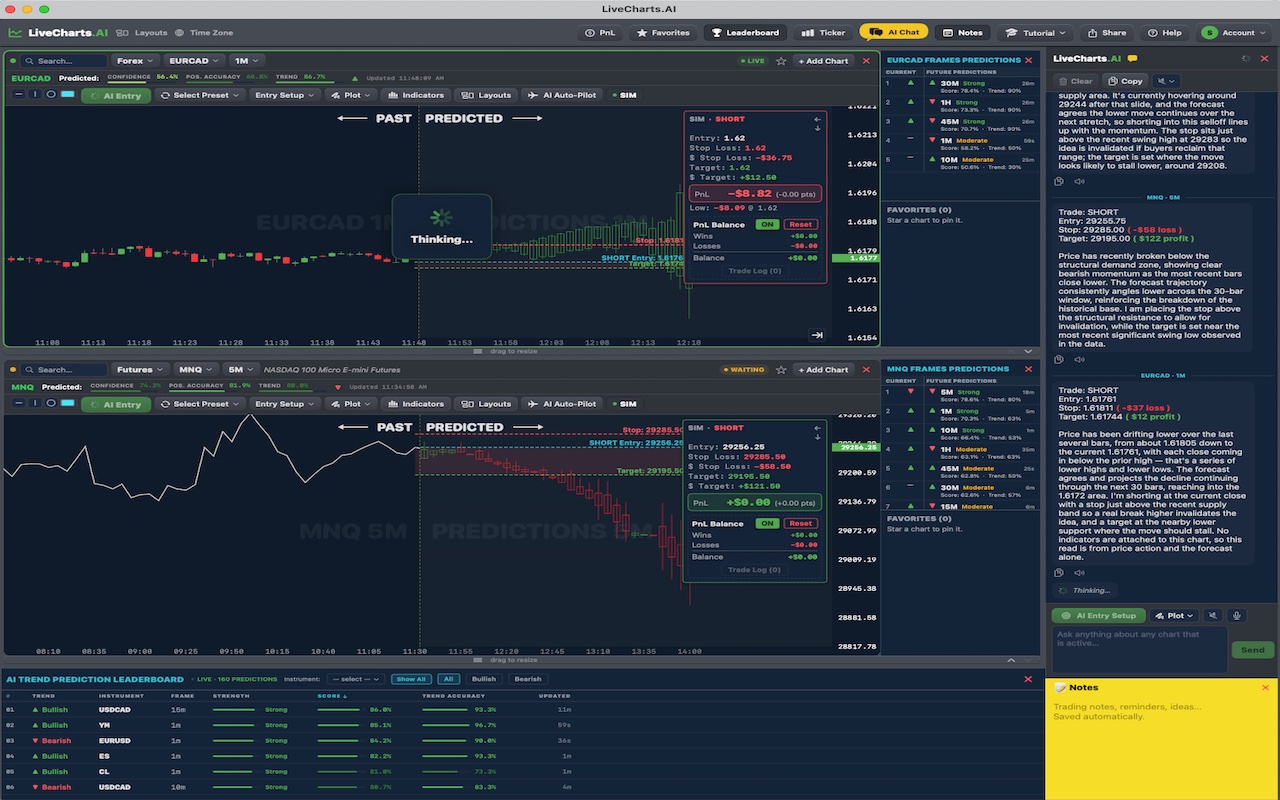
How to read this
Directional accuracy is how often the projected direction proved right; position accuracy is how closely the projected path tracked what actually happened. Confidence is LiveCharts.AI's own read. The live prediction itself is generated inside the platform.
See the live predictions — 7 day free trialSee live predictions on LiveCharts.AI →