MNQ (Micro Nasdaq 100 Futures) 15 Minute Range by Time of Day
How much does the Micro E-mini Nasdaq 100 actually move on the 15 minute chart at different times of day? The table below is measured from 1,773 recorded 15 minute bars across 5 recent sessions: for each hour of the day, the average distance between a bar's high and its low.
| Hour | Avg 15 minute range | |
|---|---|---|
| 5:00 AM ET | 7.43 pts | |
| 6:00 AM ET | 11.15 pts | |
| 7:00 AM ET | 8.46 pts | |
| 8:00 AM ET | 17.29 pts | |
| 9:00 AM ET | 15.36 pts | |
| 10:00 AM ET | 42.11 pts | |
| 1:00 PM ET | 8.29 pts | |
| 2:00 PM ET | 11.58 pts | |
| 10:00 PM ET | 8.10 pts | |
| 11:00 PM ET | 4.08 pts |
How to read this
The most active hours in this window were 10:00 AM, 8:00 AM, 9:00 AM ET, and the quietest were 11:00 PM and 5:00 AM ET. A wider bar means each interval covers more ground. The takeaway is purely observational: a fixed number of points represents a very different share of typical movement at different hours — in this window, the most active hour covered roughly 10× the ground of the quietest.
These figures shift with volatility regimes — they describe the recorded window above, not a guarantee of the next session.
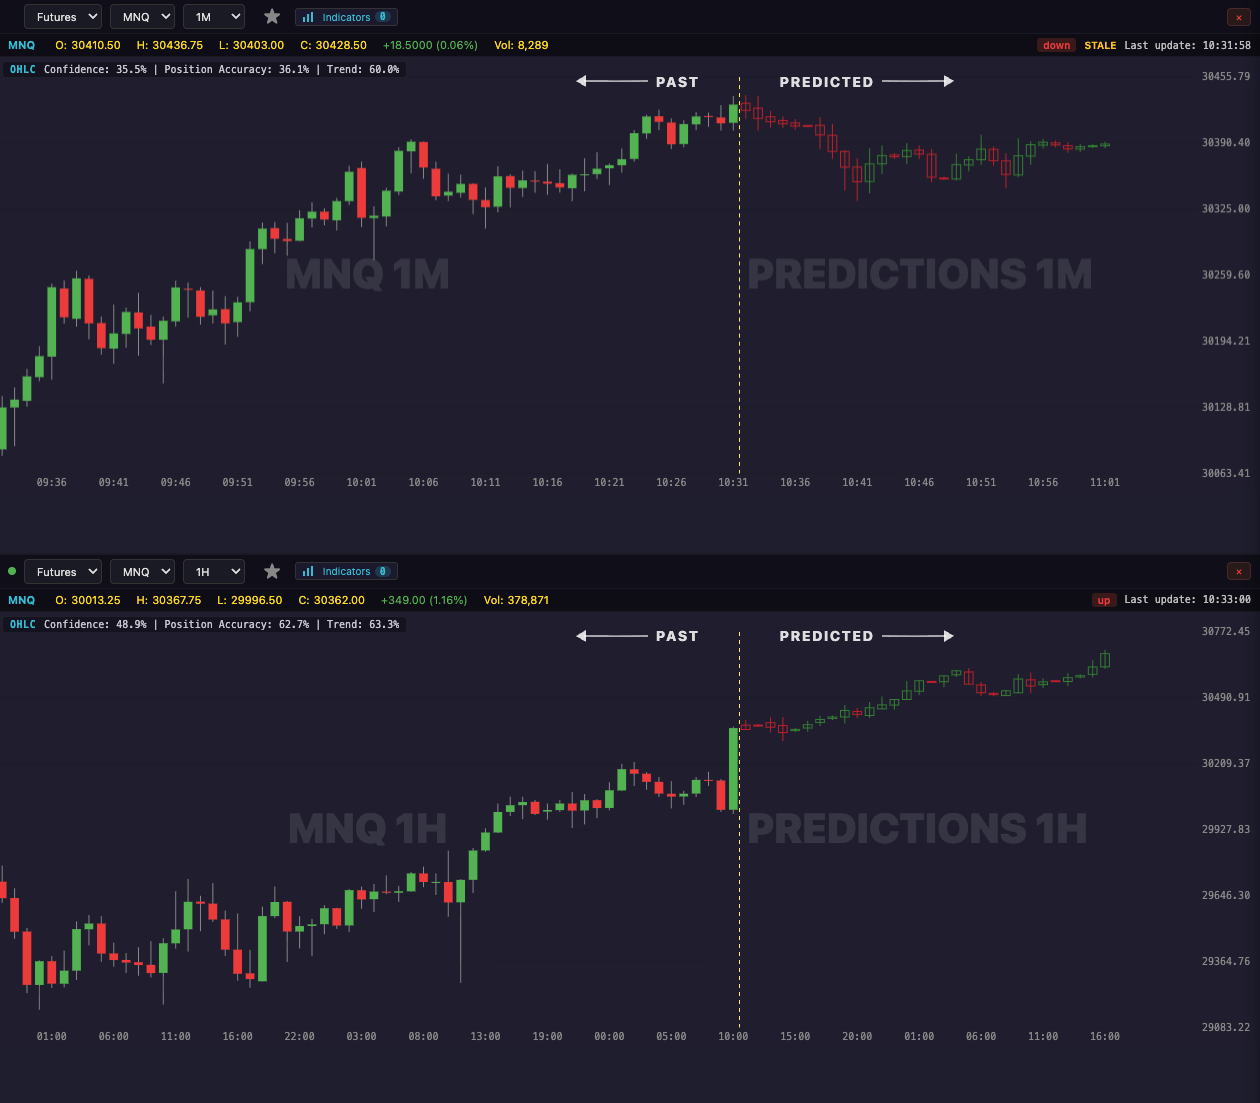
See live predictions on LiveCharts.AI →
Questions traders ask
AI tool that projects future prices MNQ LiveCharts.AI is an AI charting and prediction app built for futures day traders: live MNQ charts, predicted candles up to 30 bars ahead and an AI chat that explains the chart, on web, iPhone, iPad and Mac. Futures prediction app →
AI analysis during market movement for Micro Nasdaq 100 Futures LiveCharts.AI updates the MNQ prediction as each candle closes, so the predicted path always starts from the latest price, and the chat answers questions about the chart as it is now. AI chart analysis →
Is there a chat AI that sees the live MNQ chart? Yes. In LiveCharts.AI you chat with the live MNQ chart: ask what the predicted candles imply or where the predicted indicators turn, and the answer is about the chart in front of you. Chat with a trading chart →