Where Micro Dow MYM’s Commodity Channel Index sat on November 6, 2026
Educational reference. Measured from 1,020 recorded 1m bars of MYM on Friday, November 6, 2026.
Commodity Channel Index crossed above 100 60 separate times during the session, and the typical visit lasted 3 minutes.
Across the whole session it sat above 100 for 21.4% of the time, between -100 and 100 for 59.1%, and below -100 for 19.5%.
| Band | Share of session | Bars | Separate visits | Median visit | Longest visit |
|---|---|---|---|---|---|
| Above 100 | 21.4% | 218 | 60 | 3 min | 14 min |
| Between -100 and 100 | 59.1% | 603 | 123 | 4 min | 16 min |
| Below -100 | 19.5% | 199 | 65 | 2 min | 9 min |
Why the visit count matters more than the percentage
A share of the session says how much time a reading spent in a band. It does not say whether that time came as one sustained stretch or as repeated brief excursions. Here the reading entered the zone above 100 60 times and left it 60 times, with a median stay of 3 minutes and a longest stay of 14 minutes beginning at 08:17 ET. Below -100 there were 65 visits, a median of 2 minutes and a longest of 9 minutes.
Where in the session it happened
| Hour (ET) | Above 100 | Between | Below -100 | Bars |
|---|---|---|---|---|
| 00:00 | 17% | 62% | 22% | 60 |
| 01:00 | 32% | 53% | 15% | 60 |
| 02:00 | 27% | 40% | 33% | 60 |
| 03:00 | 25% | 67% | 8% | 60 |
| 04:00 | 37% | 45% | 18% | 60 |
| 05:00 | 8% | 58% | 33% | 60 |
| 06:00 | 15% | 65% | 20% | 60 |
| 07:00 | 18% | 58% | 23% | 60 |
| 08:00 | 40% | 52% | 8% | 60 |
| 09:00 | 38% | 52% | 10% | 60 |
| 10:00 | 23% | 57% | 20% | 60 |
| 11:00 | 18% | 67% | 15% | 60 |
| 12:00 | 5% | 75% | 20% | 60 |
| 13:00 | 25% | 72% | 3% | 60 |
| 14:00 | 5% | 58% | 37% | 60 |
| 15:00 | 12% | 58% | 30% | 60 |
| 16:00 | 18% | 67% | 15% | 60 |
Same reading, previous session: MYM 1m Commodity Channel Index, November 5, 2026
What this is and is not
This is a record of where one indicator sat during one completed session. It is not a prediction, and it makes no claim that any reading preceded a move. Whether crossing 100 tends to be followed by a larger move is a separate question, measured separately.
How this was measured
Every 1m bar recorded for MYM on Friday, November 6, 2026 — 1,020 bars from 00:00 to 16:59 ET — was classified by its Commodity Channel Index reading. A visit is an unbroken run of consecutive bars in the same band. The session was complete before this page was built.
See live predictions on LiveCharts.AI →
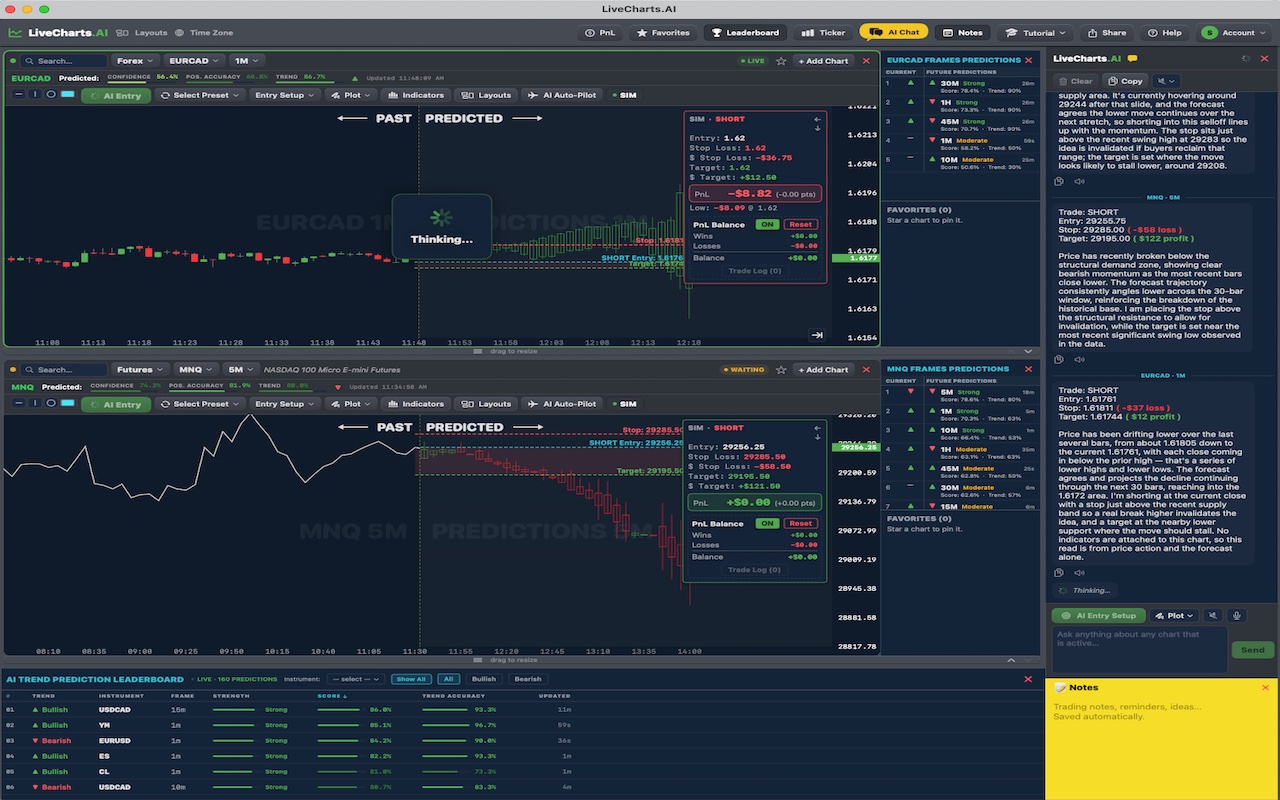
See LiveCharts.AI in action — predicted candlesticks and indicators, 30 bars into the future, before they occur:
Questions traders ask
1 minute MYM chart AI reading Yes. LiveCharts.AI predicts MYM on the 1 minute chart as on every timeframe from 1 minute to 1 hour, with the predicted indicators beside the predicted candles. Candlestick prediction →
AI trading copilot for MYM A screenshot in a general chatbot shows only one moment. LiveCharts.AI's chart chat reads the live Micro Dow Futures chart, every new bar and its predicted next candles, so you can ask where MYM is predicted to go. Chat with a trading chart →
Micro Dow Futures ask AI about my chart Yes. The LiveCharts.AI assistant answers from the MYM chart on your screen, the recent bars, the predicted path and the indicators. It does not place trades or promise outcomes. AI trading assistant →
More questions traders ask
DJIA stock price Micro Dow Futures (MYM) is live on LiveCharts.AI with the next 30 bars predicted on every timeframe from 1 minute to 1 hour, redrawn as each candle closes. A prediction is an estimate, not a certainty; the market page shows recent MYM predictions next to what happened. Micro Dow Futures predictions →
Dow premarket LiveCharts.AI predicts the path of Micro Dow Futures (MYM) 30 bars ahead on every timeframe and shows how recent predictions compared with what happened, so the record can be checked before relying on one. Micro Dow Futures predictions →
DJIA premarket Open the MYM chart on LiveCharts.AI to see where Micro Dow Futures is now and where its next 30 candles are predicted to go. Past MYM predictions are published next to what the market actually did. Micro Dow Futures predictions →