What Does Awesome Oscillator Actually Read on MNG (Micro Natural Gas Futures) 10 minute Charts?
Educational reference. Measured from 8,300 recorded values on Micro Natural Gas 10 minute charts through November 1, 2026.
The middle half of all readings sat between -0.009974 and 0.008438, with a median of -0.000926.
Awesome Oscillator measures the gap between a short and a longer average of bar midpoints, a momentum reading. This page reports what it actually read on Micro Natural Gas 10 minute charts — not what it is supposed to do, but the distribution of 8,300 recorded values over the last 90 days.
| Series | Median | Middle half | 5th / 95th | Full range |
|---|---|---|---|---|
| Awesome Oscillator | -0.000926 | -0.009974 – 0.008438 | -0.0314 / 0.0329 | -0.1215 – 0.2925 |
The median is the middle reading, so a single unusual session cannot drag it. The middle half is where Awesome Oscillator sat on half of all bars — the range you should expect to see most of the time on this chart.
See LiveCharts.AI predicting Awesome Oscillator on Micro Natural Gas — 7 day free trial →
How this was measured
Every 10 minute bar of Micro Natural Gas recorded in the last 90 days was read, and the values grouped without smoothing or filtering. Series with fewer than 400 readings are omitted rather than shown on thin evidence. These are recorded values, not predictions.
See how much MNG moves by hour on this timeframe →
See live predictions on LiveCharts.AI →
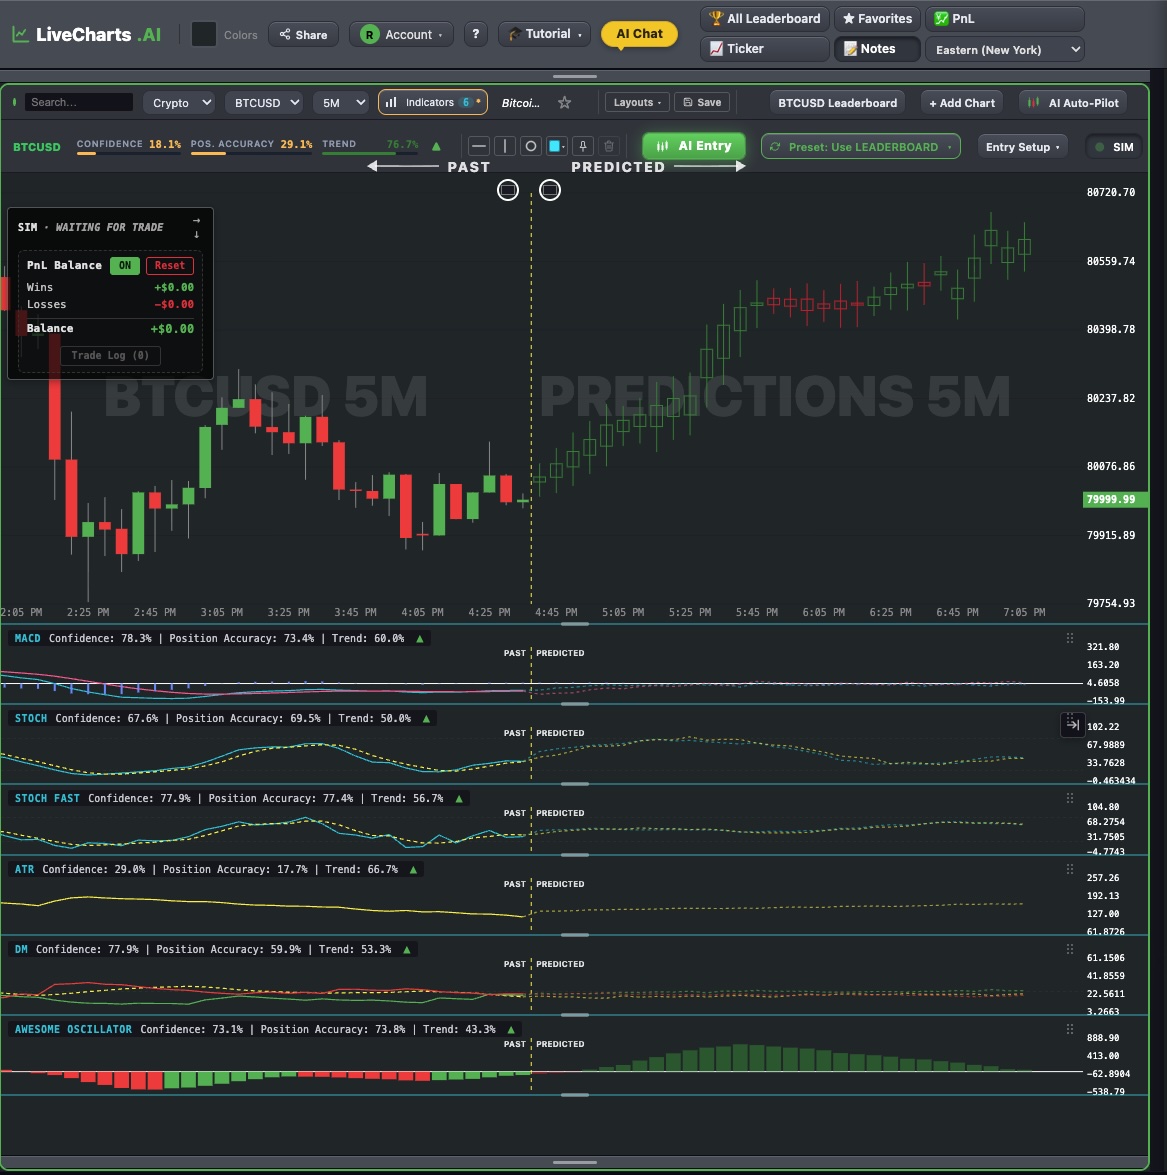
See LiveCharts.AI in action — predicted candlesticks and indicators, 30 bars into the future, before they occur:
Questions traders ask
10 minute price prediction using AI On the 10 minute MNG chart LiveCharts.AI predicts the next 30 candles, about 5 hours ahead, and redraws them as each 10 minute candle closes. Candlestick prediction →
Interactive chart analysis assistant for MNG LiveCharts.AI's chat reads the same MNG chart you are looking at: ask where the prediction changes direction, what the predicted highs and lows are, or how today compares with yesterday. AI trading assistant →
AI chart prediction app for Micro Natural Gas Futures LiveCharts.AI is AI trading software for the chart itself: it predicts the next 30 candles of Micro Natural Gas Futures and where the indicators are heading, and answers questions about the chart in a chat. It does not place trades. AI trading software →
More questions traders ask
CME natural gas LiveCharts.AI predicts the path of Micro Natural Gas Futures (MNG) 30 bars ahead on every timeframe and shows how recent predictions compared with what happened, so the record can be checked before relying on one. Micro Natural Gas Futures predictions →
Trade natural gas futures For Micro Natural Gas Futures, LiveCharts.AI draws predicted candlesticks and indicators to the right of the live price, and its AI chat answers questions about the MNG chart. Predictions are estimates, not certainties. Micro Natural Gas Futures predictions →
Nymex natural gas futures Micro Natural Gas Futures (MNG) is live on LiveCharts.AI with the next 30 bars predicted on every timeframe from 1 minute to 1 hour, redrawn as each candle closes. A prediction is an estimate, not a certainty; the market page shows recent MNG predictions next to what happened. Micro Natural Gas Futures predictions →