What Does Directional Movement and ADX Actually Read on MNG 10-minute Charts?
Educational reference. Measured from 5,063 recorded values on Micro Natural Gas 10-minute charts through September 18, 2026.
The middle half of all readings sat between 16.99 and 29.17, with a median of 22.14.
Directional Movement and ADX measures how strongly a market is trending, and which side is doing the work. This page reports what it actually read on Micro Natural Gas 10-minute charts — not what it is supposed to do, but the distribution of 5,063 recorded values over the last 90 days.
| Series | Median | Middle half | 5th / 95th | Full range |
|---|---|---|---|---|
| ADX | 22.14 | 16.99 – 29.17 | 12.29 / 42.11 | 7.44 – 67.89 |
| DiPlus | 25.51 | 19.93 – 31.81 | 12.83 / 41.54 | 5.25 – 64.54 |
| DiMinus | 24.58 | 18.60 – 30.60 | 12.30 / 39.66 | 2.81 – 73.00 |
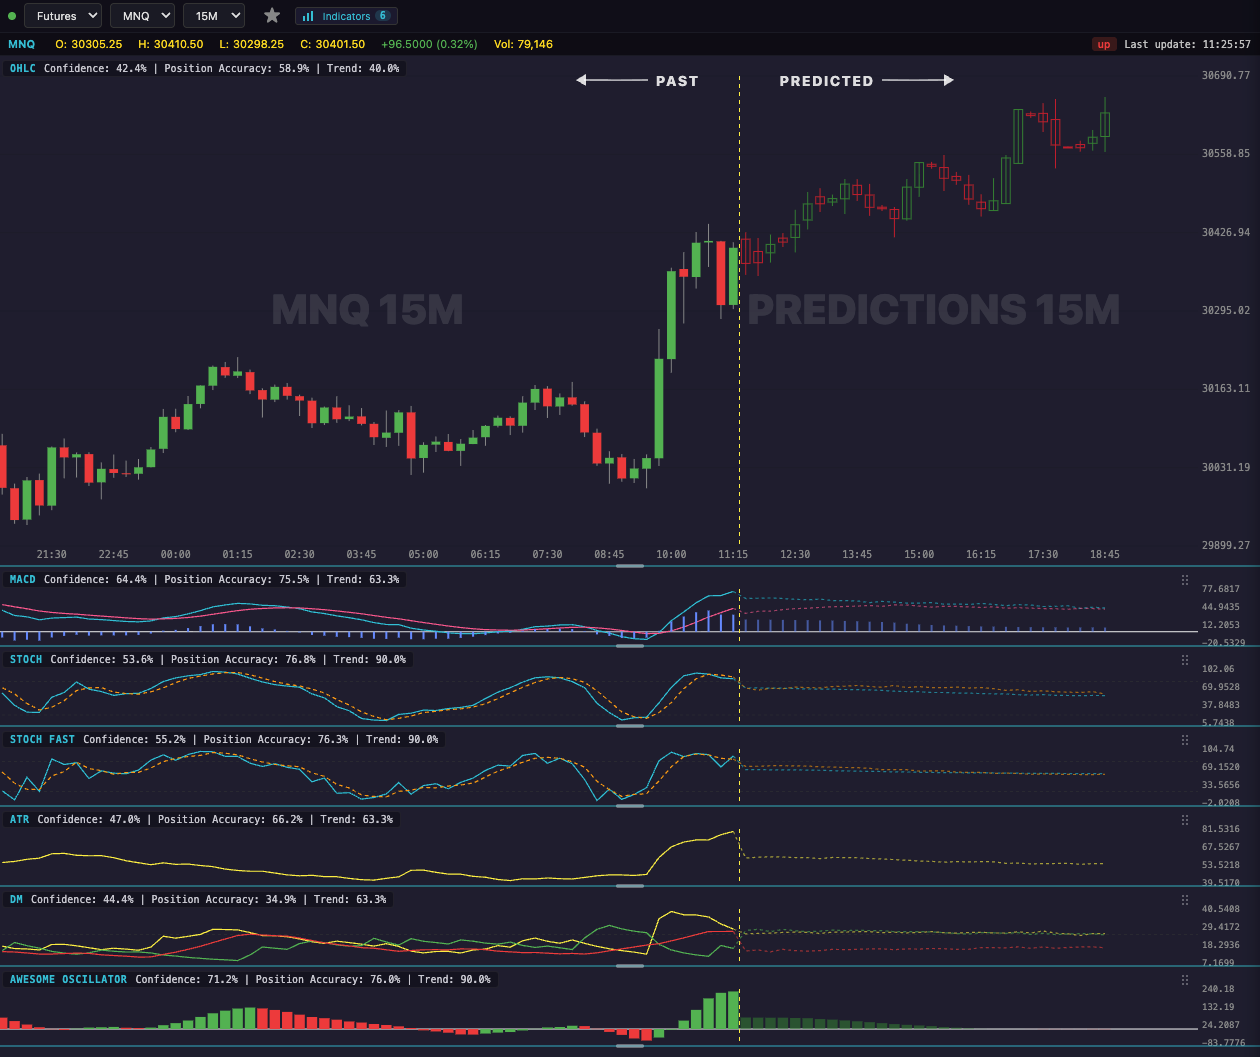
The median is the middle reading, so a single unusual session cannot drag it. The middle half is where Directional Movement and ADX sat on half of all bars — the range you should expect to see most of the time on this chart.
See LiveCharts.AI forecasting Directional Movement and ADX on Micro Natural Gas — 7-day free trial →
How this was measured
Every 10-minute bar of Micro Natural Gas recorded in the last 90 days was read, and the values grouped without smoothing or filtering. Series with fewer than 400 readings are omitted rather than shown on thin evidence. These are recorded values, not forecasts.
See how much MNG moves by hour on this timeframe →
See live predictions on LiveCharts.AI →
Questions traders ask
Live ADX future values LiveCharts.AI predicts where the ADX goes next on MNG, up to 30 bars ahead, next to the predicted candles, and publishes how its recent ADX predictions compared with what happened. Predictive indicators →
Can trading software predict upcoming MNG price bars? LiveCharts.AI is an AI charting and prediction app built for futures day traders: live MNG charts, predicted candles up to 30 bars ahead and an AI chat that explains the chart, on web, iPhone, iPad and Mac. Futures prediction app →
AI for scalping MNG on the 1 minute chart For day trading MNG, LiveCharts.AI predicts the next candles on the 1, 5, 10 and 15 minute charts and redraws the prediction as each bar closes, so you see when it changes during the session. AI tools for day traders →