Where S&P 500 E-mini ES’s ADX sat on October 23, 2026
Educational reference. Measured from 204 recorded 5m bars of ES on Friday, October 23, 2026.
ADX crossed above 25 2 separate times during the session, and the typical visit lasted 155 minutes.
Across the whole session it sat above 25 for 30.4% of the time, between 20 and 25 for 16.7%, and below 20 for 52.9%.
| Band | Share of session | Bars | Separate visits | Median visit | Longest visit |
|---|---|---|---|---|---|
| Above 25 | 30.4% | 62 | 2 | 155 min | 185 min |
| Between 20 and 25 | 16.7% | 34 | 7 | 20 min | 45 min |
| Below 20 | 52.9% | 108 | 6 | 82 min | 170 min |
Why the visit count matters more than the percentage
A share of the session says how much time a reading spent in a band. It does not say whether that time came as one sustained stretch or as repeated brief excursions. Here the reading entered the zone above 25 2 times and left it 2 times, with a median stay of 155 minutes and a longest stay of 185 minutes beginning at 08:35 ET. Below 20 there were 6 visits, a median of 82 minutes and a longest of 170 minutes.
Where in the session it happened
| Hour (ET) | Above 25 | Between | Below 20 | Bars |
|---|---|---|---|---|
| 00:00 | 0% | 0% | 100% | 12 |
| 01:00 | 0% | 0% | 100% | 12 |
| 02:00 | 0% | 17% | 83% | 12 |
| 03:00 | 0% | 17% | 83% | 12 |
| 04:00 | 0% | 25% | 75% | 12 |
| 05:00 | 25% | 25% | 50% | 12 |
| 06:00 | 100% | 0% | 0% | 12 |
| 07:00 | 83% | 17% | 0% | 12 |
| 08:00 | 42% | 58% | 0% | 12 |
| 09:00 | 100% | 0% | 0% | 12 |
| 10:00 | 100% | 0% | 0% | 12 |
| 11:00 | 67% | 33% | 0% | 12 |
| 12:00 | 0% | 8% | 92% | 12 |
| 13:00 | 0% | 58% | 42% | 12 |
| 14:00 | 0% | 8% | 92% | 12 |
| 15:00 | 0% | 0% | 100% | 12 |
| 16:00 | 0% | 17% | 83% | 12 |
Same reading, previous session: ES 5m ADX, October 22, 2026
What this is and is not
This is a record of where one indicator sat during one completed session. It is not a prediction, and it makes no claim that any reading preceded a move. Whether crossing 25 tends to be followed by a larger move is a separate question, measured separately.
How this was measured
Every 5m bar recorded for ES on Friday, October 23, 2026 — 204 bars from 00:00 to 16:55 ET — was classified by its ADX reading. A visit is an unbroken run of consecutive bars in the same band. The session was complete before this page was built.
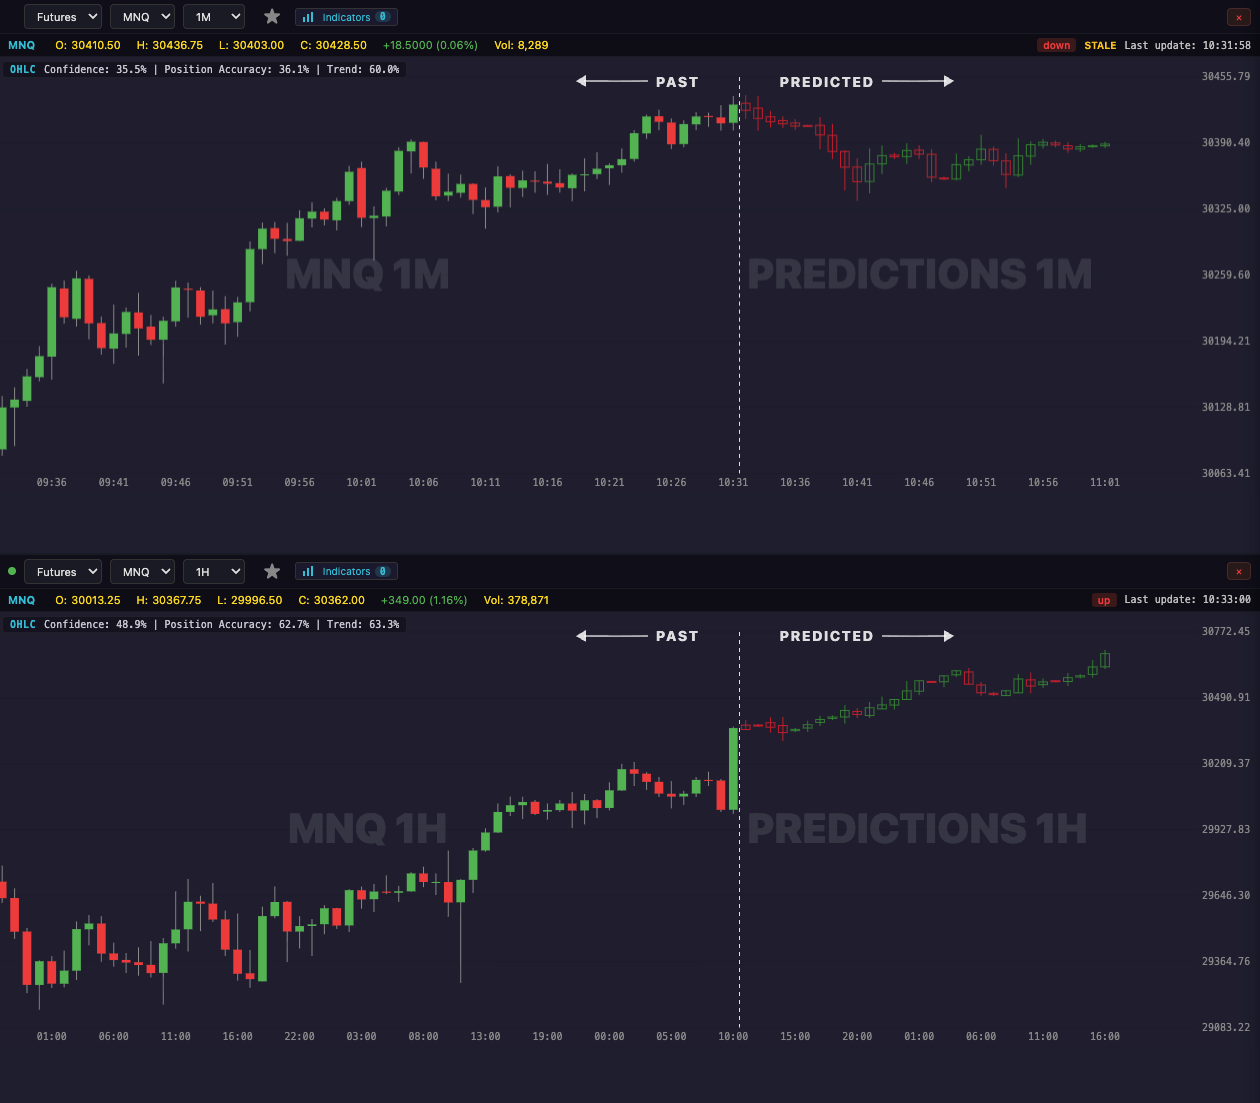
See live predictions on LiveCharts.AI →
Questions traders ask
5 minute crypto candle analysis for day trading On the 5 minute ES chart LiveCharts.AI predicts the next 30 candles, about 2 hours ahead, and redraws them as each 5 minute candle closes. Candlestick prediction →
AI price prediction app for ES LiveCharts.AI is an AI charting and prediction app built for futures day traders: live ES charts, predicted candles up to 30 bars ahead and an AI chat that explains the chart, on web, iPhone, iPad and Mac. Futures prediction app →
ES predict upcoming candle direction LiveCharts.AI predicts the next 30 candles of S&P 500 E-mini Futures on every timeframe from 1 minute to 1 hour, drawn on the live chart. It is a prediction, not a certainty, so LiveCharts.AI publishes how its recent ES predictions compared with what happened. Candlestick prediction →