ES (S&P 500 E-mini Futures) Supertrend, Donchian, Aroon and 5 More Indicators on the 5 Minute Chart: Prediction vs Actual, October 16, 2026
On Friday, October 16, 2026, at 11 checks from 10:00 AM to 3:00 PM ET, eight indicators of E-mini S&P 500 futures (ES) were computed one hour ahead from the LiveCharts.AI predicted 5 minute bars. The predicted state matched the state that printed at 51 of 88 readings.
These eight indicators are not predicted by LiveCharts.AI directly. This page computes each of them from our own 5 minute bars with the twelve predicted 5 minute bars of the next hour added on the end, and sets the result beside the same indicator computed from the twelve bars that actually printed. Each is read as a simple two way state: Supertrend (10, 3) close above or below the line; Donchian channel (20) close in the upper or lower half; Aroon (25) up leading or down leading; Stochastic RSI (14) above 50 or not; Hull moving average (20) rising or not; Choppiness index (14) above 50 or not; Fisher transform (10) above 0 or not; Elder ray bull power (13) above 0 or not.
October 16, 2026: the state one hour ahead, predicted / actual (5 minute chart)
| Indicator | From 10:00 AM | From 3:00 PM |
|---|---|---|
| Supertrend | below / below yes | below / below yes |
| Donchian | lower half / lower half yes | lower half / upper half |
| Aroon | down leads / down leads yes | down leads / up leads |
| Stochastic RSI | 50 or below / above 50 | 50 or below / above 50 |
| Hull MA | not rising / rising | not rising / rising |
| Choppiness | above 50 / above 50 yes | above 50 / above 50 yes |
| Fisher | 0 or below / above 0 | 0 or below / above 0 |
| Elder bull power | 0 or below / 0 or below yes | 0 or below / above 0 |
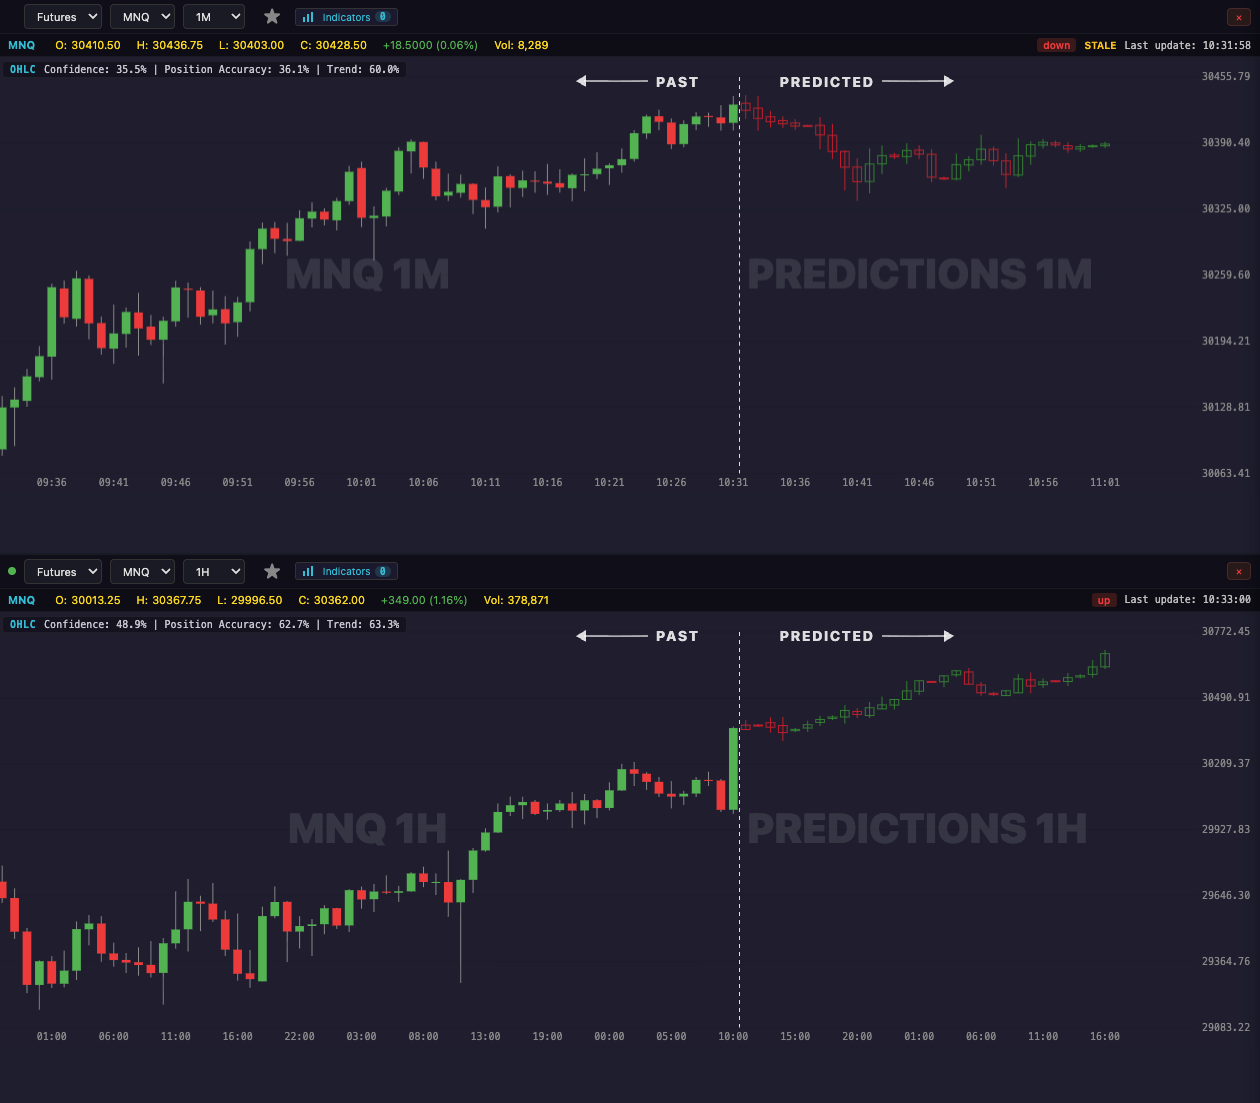
Every ES session since October 6 (5 minute chart)
Across 792 indicator readings (99 checks × 8 indicators) on 9 sessions since the current prediction model began on October 6, the predicted state one hour ahead matched the state that printed at 480 of 792. Simply assuming every state stays as it is matched at 445 of 792. The state actually changed within the hour at 347 readings; the prediction had the new state at 145 of those.
On MES, the Micro S&P 500 futures contract, the predicted states one hour ahead matched (all eight indicators together) on 471 of 792.
| Indicator | Prediction right | Stays as it is right |
|---|---|---|
| Supertrend | 77 of 99 | 76 of 99 |
| Donchian | 59 of 99 | 61 of 99 |
| Aroon | 75 of 99 | 66 of 99 |
| Stochastic RSI | 53 of 99 | 41 of 99 |
| Hull MA | 53 of 99 | 44 of 99 |
| Choppiness | 46 of 99 | 43 of 99 |
| Fisher | 60 of 99 | 52 of 99 |
| Elder bull power | 57 of 99 | 62 of 99 |
| Session | Readings | Prediction right | Stays as it is right |
|---|---|---|---|
| Fri Oct 16 | 88 | 51 | 60 |
| Thu Oct 15 | 88 | 44 | 35 |
| Wed Oct 14 | 88 | 62 | 60 |
| Tue Oct 13 | 88 | 58 | 41 |
| Mon Oct 12 | 88 | 51 | 46 |
| Fri Oct 9 | 88 | 63 | 56 |
| Thu Oct 8 | 88 | 36 | 43 |
| Wed Oct 7 | 88 | 66 | 61 |
| Tue Oct 6 | 88 | 49 | 43 |
Based on LiveCharts.AI's recorded predictions compared with what the market actually did.
What it does and does not say
This page computes eight indicators from recorded ES 5 minute bars and from the predicted bars. It does not describe any indicator state as a reason to act, and the sessions shown are too few to describe the predictions in general.