ES (S&P 500 E-mini Futures) Close Prediction vs the Actual 4:00 PM Close on the 30 Minute Chart, October 14, 2026
E-mini S&P 500 futures (ES) closed the cash session of Wednesday, October 14, 2026 at 7,771.75 (the 30 minute bar ending 4:00 PM ET). At the 9:30 AM open, the LiveCharts.AI 30 minute prediction put the 4:00 PM price at 7,821.75, +50.00 points from the actual, and had the direction from the open to the close right (down; actual down). The latest session, Thursday, October 15, 2026, is not the example because the 9:30 AM prediction had the direction to the close wrong; this page uses the latest session where it was right.
Same day (0DTE) options traders on the S&P 500 follow where the index finishes the day. This page covers only E-mini S&P 500 futures, not options: it shows where the recorded 30 minute predictions put the ES price at the 4:00 PM ET close, at five points in the session, and where ES actually closed. It contains nothing about option prices, strikes or expiries.
October 14, 2026: the predicted 4:00 PM close at each point in the session (30 minute chart)
| Made at (ET) | ES then | Predicted 4:00 PM | Actual 4:00 PM | Difference | Direction to the close, pred / actual | Same |
|---|---|---|---|---|---|---|
| 9:30 AM | 7,824.00 | 7,821.75 | 7,771.75 | +50.00 | down / down | yes |
| 12:00 PM | 7,782.50 | 7,767.50 | 7,771.75 | -4.25 | down / down | yes |
| 2:00 PM | 7,749.50 | 7,725.00 | 7,771.75 | -46.75 | down / up | no |
| 3:00 PM | 7,751.25 | 7,738.00 | 7,771.75 | -33.75 | down / up | no |
| 3:30 PM | 7,763.75 | 7,755.00 | 7,771.75 | -16.75 | down / up | no |
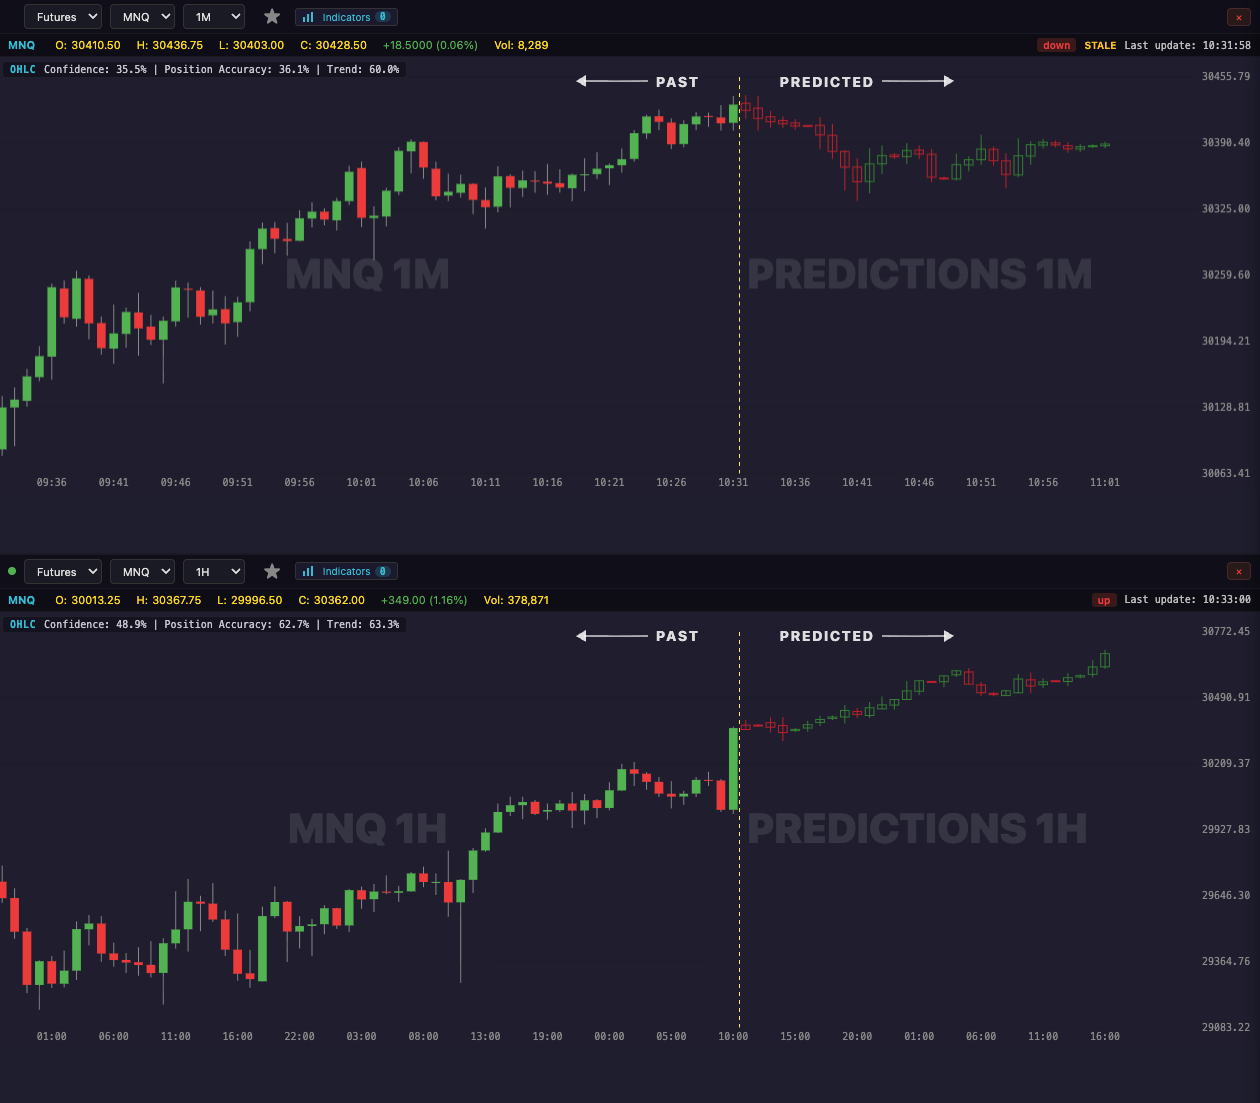
Every ES session since October 6 (30 minute chart)
The prediction made at 9:30 AM had the direction from the open to the 4:00 PM close right on 5 of 8 sessions since the current prediction model began on October 6.
On MES, the Micro S&P 500 futures contract, the 9:30 AM prediction had the direction to the 4:00 PM close right on 5 of 8 of the same sessions.
| Session | ES at 9:30 AM | Predicted 4:00 PM | Actual 4:00 PM | Direction, pred / actual | Same |
|---|---|---|---|---|---|
| Thu Oct 15 | 7,735.50 | 7,725.25 | 7,790.75 | down / up | no |
| Wed Oct 14 | 7,824.00 | 7,821.75 | 7,771.75 | down / down | yes |
| Tue Oct 13 | 7,849.00 | 7,850.50 | 7,856.00 | up / up | yes |
| Mon Oct 12 | 7,863.25 | 7,863.75 | 7,856.50 | up / down | no |
| Fri Oct 9 | 7,838.25 | 7,844.75 | 7,861.00 | up / up | yes |
| Thu Oct 8 | 7,827.25 | 7,809.25 | 7,817.50 | down / down | yes |
| Wed Oct 7 | 7,837.50 | 7,819.50 | 7,851.25 | down / up | no |
| Tue Oct 6 | 7,862.75 | 7,876.75 | 7,873.00 | up / up | yes |
By the time the prediction was made: median miss is the median distance between the predicted and actual close; median move is the median distance ES actually travelled from that time to the close, which is the miss you would get by taking the price at that moment as the close. The predicted close was nearer at the median at 1 of the 5 checkpoints.
| Made at (ET) | Sessions | Direction to close matched | Median miss (pts) | Median move to close (pts) |
|---|---|---|---|---|
| 9:30 AM | 8 | 5 | 12.25 | 12.00 |
| 12:00 PM | 8 | 4 | 8.12 | 11.62 |
| 2:00 PM | 8 | 3 | 11.88 | 5.38 |
| 3:00 PM | 8 | 1 | 8.88 | 8.25 |
| 3:30 PM | 8 | 0 | 11.12 | 4.12 |
Based on LiveCharts.AI's recorded predictions compared with what the market actually did.
What it does and does not say
This page records predicted and actual ES closing prices. It is not an options strategy and gives no view on any option.