Gold Historical Price: GC 10 Minute Williams %R Prediction vs What Happened, October 30, 2026
Searching “gold historical price”? Here is gold futures (GC) on the 10 minute chart: at 10:00 AM ET on Friday, October 30, 2026 the LiveCharts.AI prediction had the Williams %R heading up over the next 30 bars, and the Williams %R went up.
See LiveCharts.AI in action — predicted candlesticks and indicators, 30 bars into the future, before they occur:
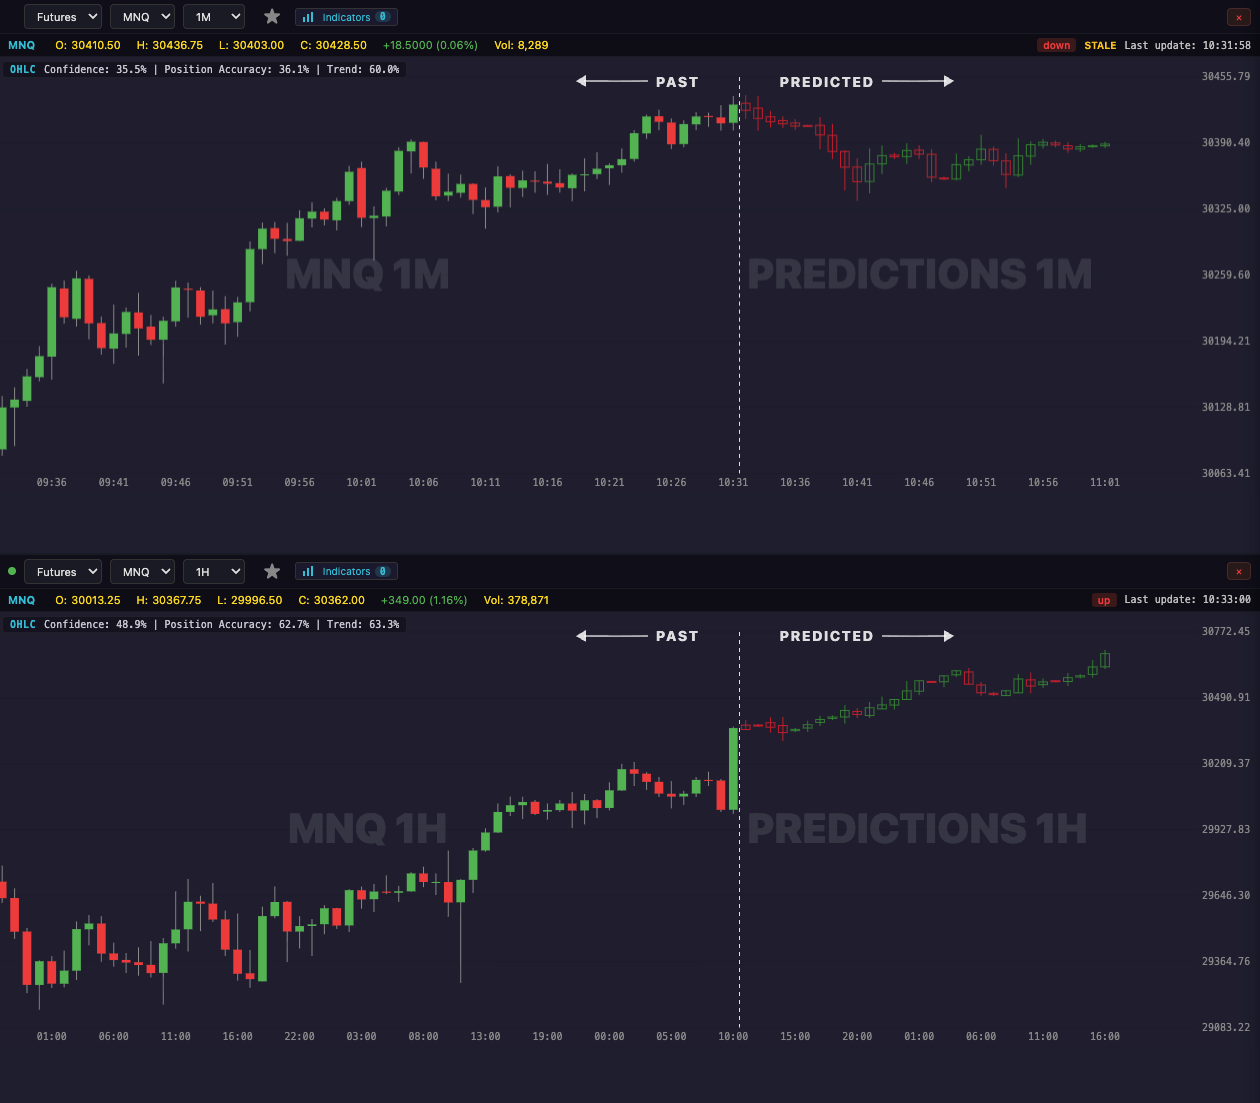
Every session since October 6: the 10:00 AM Williams %R prediction on the GC 10 minute chart
The Williams %R prediction made at 10:00 AM ET went the right way over the next 30 bars on 12 of 18 sessions; always guessing the same direction would have been right on 10.
| Session | Predicted Williams %R | What happened | Same direction |
|---|---|---|---|
| Fri Oct 30 | up | up | yes |
| Wed Oct 28 | down | down | yes |
| Tue Oct 27 | down | down | yes |
| Mon Oct 26 | up | down | no |
| Fri Oct 23 | up | up | yes |
| Thu Oct 22 | up | down | no |
| Wed Oct 21 | down | down | yes |
| Tue Oct 20 | down | down | yes |
| Mon Oct 19 | up | up | yes |
| Fri Oct 16 | up | down | no |
| Thu Oct 15 | down | up | no |
| Wed Oct 14 | up | up | yes |
| Tue Oct 13 | up | up | yes |
| Mon Oct 12 | down | down | yes |
| Fri Oct 9 | down | up | no |
| Thu Oct 8 | down | down | yes |
| Wed Oct 7 | up | down | no |
| Tue Oct 6 | up | up | yes |
Based on LiveCharts.AI's recorded predictions compared with what the market actually did.
What it does and does not say
This page records what the LiveCharts.AI Williams %R prediction said for GC on the 10 minute chart and what the Williams %R did next. It does not describe any indicator reading as a reason to act.