How Far Is YM (Dow E-mini Futures) From Its 50 EMA on the 5 Minute Chart? Prediction vs Actual, November 4, 2026
On Wednesday, November 4, 2026, E-mini Dow futures (YM) was at least 1 ATR away from its 50 period EMA on the 5 minute chart at 11 of 11 checks. At 9 of those 11, the LiveCharts.AI prediction had the direction of the next hour right.
“How far is YM from the 50 EMA?” The distance is just a number: the 5 minute close minus the 50 period exponential moving average of the 5 minute closes, in points and in multiples of the 14 period ATR (Wilder) of the same bars. The page does not say what a distance means. It sets each recorded next hour prediction beside what YM then did, at the checks where the close was at least 1 ATR away.
Every check on November 4, 2026 (5 minute chart)
| Time (ET) | YM | 50 EMA | Distance (points) | Distance (ATRs) | Next hour, pred / actual | Same |
|---|---|---|---|---|---|---|
| 10:00 AM | 53,024 | 52,833 | +191 | +2.6 | up / up | yes |
| 10:30 AM | 52,981 | 52,871 | +110 | +1.4 | up / up | yes |
| 11:00 AM | 53,279 | 52,938 | +341 | +4.4 | up / up | yes |
| 11:30 AM | 53,166 | 52,998 | +168 | +2.3 | up / up | yes |
| 12:00 PM | 53,453 | 53,079 | +374 | +4.9 | up / down | no |
| 12:30 PM | 53,414 | 53,153 | +261 | +3.8 | up / up | yes |
| 1:00 PM | 53,436 | 53,210 | +226 | +4.2 | up / up | yes |
| 1:30 PM | 53,425 | 53,257 | +168 | +3.6 | up / up | yes |
| 2:00 PM | 53,451 | 53,296 | +155 | +3.7 | up / up | yes |
| 2:30 PM | 53,481 | 53,336 | +145 | +4.0 | up / up | yes |
| 3:00 PM | 53,470 | 53,367 | +103 | +3.0 | down / up | no |
Every YM session since October 6 (5 minute chart)
Across 19 sessions since the current prediction model began on October 6, YM was at least 1 ATR from its 50 EMA at 151 of 209 checks. At those 151, the predicted next hour direction matched at 81 of 151. Simply assuming YM moves back toward the 50 EMA matched at 63 of 151. At all 209 checks, whatever the distance, the predicted direction matched at 116.
On MYM, the Micro Dow futures contract, at checks at least 1 ATR from its own 50 EMA the predicted next hour direction matched on 82 of 150.
| Session | Checks | At least 1 ATR away | Prediction right | Back toward the EMA |
|---|---|---|---|---|
| Wed Nov 4 | 11 | 11 | 9 | 1 |
| Mon Nov 2 | 11 | 8 | 5 | 4 |
| Fri Oct 30 | 11 | 11 | 8 | 3 |
| Wed Oct 28 | 11 | 8 | 7 | 2 |
| Tue Oct 27 | 11 | 4 | 1 | 4 |
| Mon Oct 26 | 11 | 6 | 2 | 4 |
| Fri Oct 23 | 11 | 3 | 1 | 3 |
| Thu Oct 22 | 11 | 6 | 1 | 5 |
| Wed Oct 21 | 11 | 8 | 3 | 3 |
| Tue Oct 20 | 11 | 10 | 3 | 6 |
| Mon Oct 19 | 11 | 4 | 2 | 3 |
| Fri Oct 16 | 11 | 8 | 3 | 3 |
| Thu Oct 15 | 11 | 10 | 6 | 3 |
| Wed Oct 14 | 11 | 9 | 3 | 4 |
| Tue Oct 13 | 11 | 9 | 7 | 2 |
| Mon Oct 12 | 11 | 5 | 2 | 3 |
| Fri Oct 9 | 11 | 11 | 9 | 1 |
| Thu Oct 8 | 11 | 9 | 4 | 3 |
| Wed Oct 7 | 11 | 11 | 5 | 6 |
Based on LiveCharts.AI's recorded predictions compared with what the market actually did.
What it does and does not say
This page records the distance of YM from its 50 EMA and the predictions made at those moments. It does not describe any distance as too far or as a reason to act, and the sessions shown are too few to describe the predictions in general.
See live predictions on LiveCharts.AI →
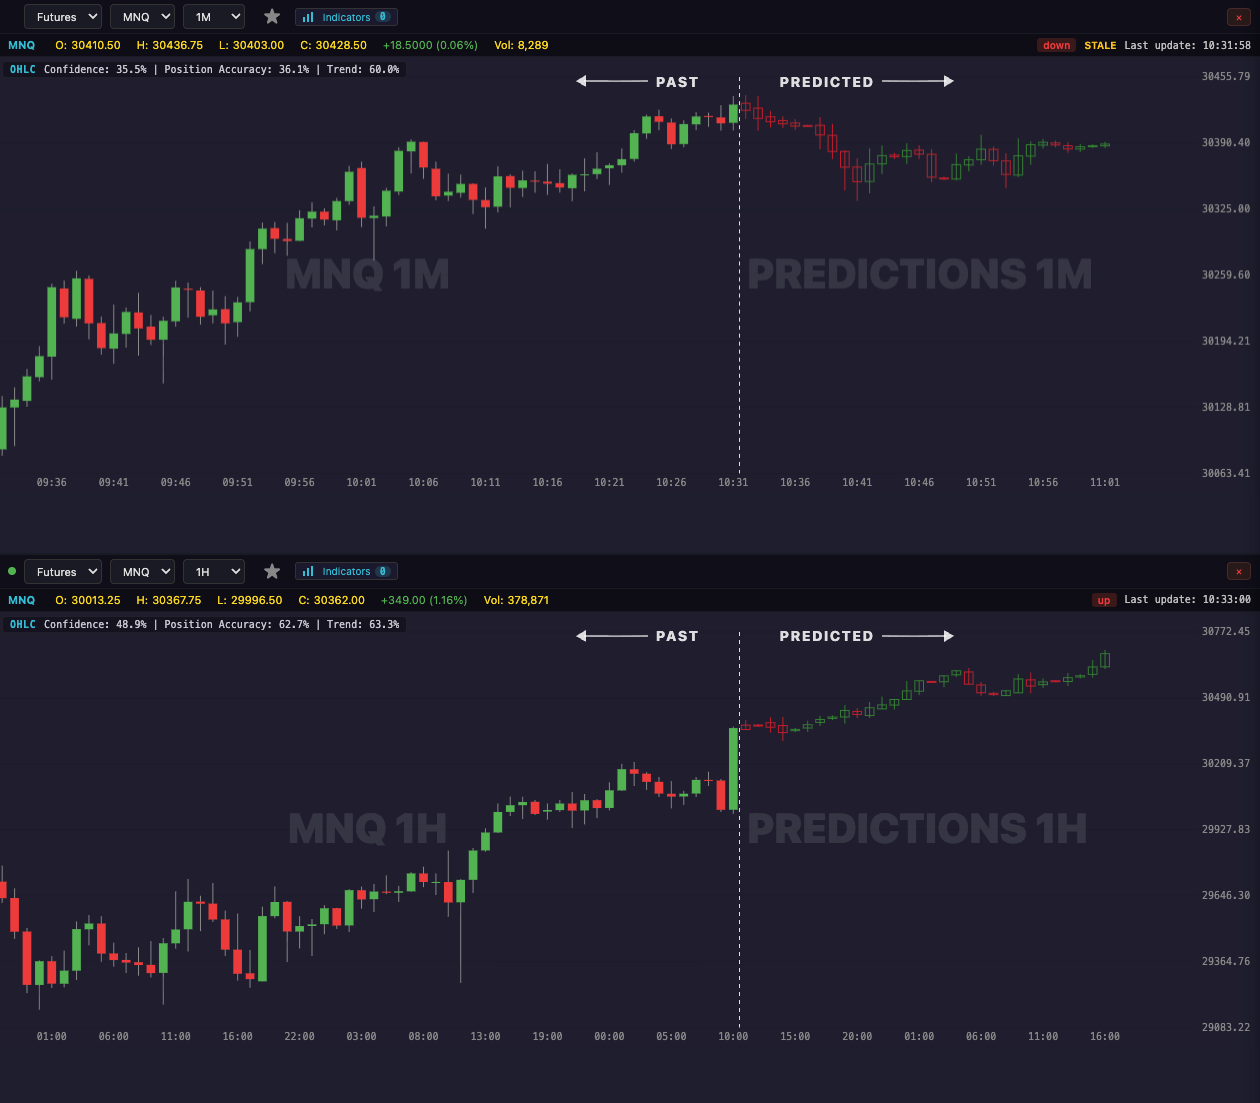
See LiveCharts.AI in action — predicted candlesticks and indicators, 30 bars into the future, before they occur:
More questions traders ask
Dow futures right now E-mini Dow futures (YM) is live on LiveCharts.AI with the next 30 bars predicted on every timeframe from 1 minute to 1 hour, redrawn as each candle closes. A prediction is an estimate, not a certainty; the market page shows recent YM predictions next to what happened. E-mini Dow futures predictions →
Stock market close today dow jones Open the YM chart on LiveCharts.AI to see where E-mini Dow futures is now and where its next 30 candles are predicted to go. Past YM predictions are published next to what the market actually did. E-mini Dow futures predictions →
Stocks today dow jones LiveCharts.AI predicts the path of E-mini Dow futures (YM) 30 bars ahead on every timeframe and shows how recent predictions compared with what happened, so the record can be checked before relying on one. E-mini Dow futures predictions →