MBT (Micro Bitcoin Futures) RSI vs MACD on the 5 Minute Chart: Which Prediction Landed Closer? October 16, 2026
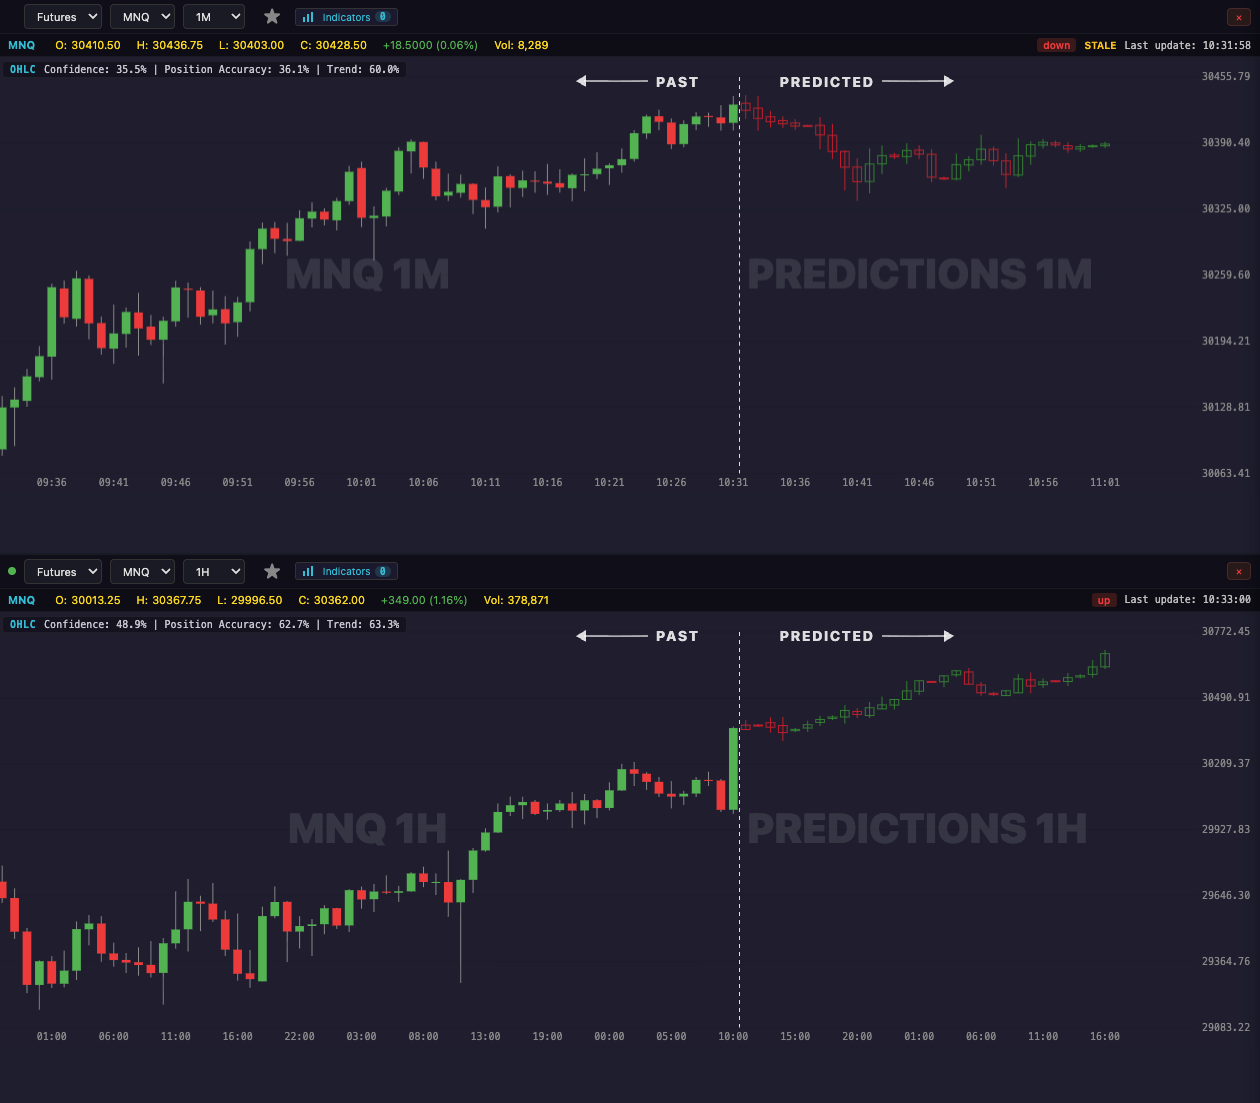
On Friday, October 16, 2026, at 6 checks from 10:00 AM to 2:30 PM ET, LiveCharts.AI predicted both the RSI and the MACD of Micro Bitcoin futures (MBT) on the 5 minute chart for the next hour. The predicted RSI moved the right way at 5 of 6 checks and the predicted MACD at 4 of 6.
“RSI vs MACD” is usually an argument about which indicator to use. This page does not take sides. Both indicators are predicted directly, thirty 5 minute bars ahead; the page compares each prediction with the value that printed. RSI is the 14 period RSI with Wilder smoothing; MACD is the 12 and 26 period EMA difference of the 5 minute closes. To compare different scales, the miss one hour ahead is shown as a share of each indicator’s own range over the last 100 bars.
Every check on October 16, 2026 (5 minute chart)
| Time (ET) | RSI | RSI next hour, pred / actual | Same | MACD | MACD next hour, pred / actual | Same | Landed closer |
|---|---|---|---|---|---|---|---|
| 10:00 AM | 45.5 | up / down | no | -108.34 | up / up | yes | RSI |
| 11:30 AM | 35.5 | up / up | yes | -148.25 | down / up | no | MACD |
| 12:00 PM | 30.0 | up / up | yes | -188.32 | down / up | no | RSI |
| 1:00 PM | 40.3 | up / up | yes | -113.57 | up / up | yes | MACD |
| 2:00 PM | 43.2 | up / up | yes | -103.27 | up / up | yes | MACD |
| 2:30 PM | 50.0 | up / up | yes | -52.62 | up / up | yes | MACD |
Every MBT session since October 6 (5 minute chart)
Across 52 checks on 10 sessions since the current prediction model began on October 6, the predicted RSI moved the right way over the next hour at 33 of 52 and the predicted MACD at 35 of 52. Simply assuming each indicator keeps moving the way it moved over the last bar matched at 18 (RSI) and 30 (MACD). One hour ahead, the RSI prediction landed closer, as a share of its own range, at 23 of 52 checks; the median miss was 16% of the range for RSI and 15% for MACD.
On BIT, the Nano Bitcoin futures contract, the predicted RSI and MACD directions over the next hour matched (both indicators together) on 56 of 82 (BIT has complete recorded data on 5 of the 10 sessions).
| Session | Checks | RSI right | MACD right | RSI closer |
|---|---|---|---|---|
| Mon Oct 19 | 6 | 2 | 2 | 0 |
| Fri Oct 16 | 6 | 5 | 4 | 2 |
| Thu Oct 15 | 6 | 4 | 4 | 2 |
| Wed Oct 14 | 7 | 5 | 6 | 6 |
| Tue Oct 13 | 4 | 0 | 3 | 1 |
| Mon Oct 12 | 3 | 2 | 3 | 1 |
| Fri Oct 9 | 4 | 1 | 2 | 3 |
| Thu Oct 8 | 6 | 6 | 4 | 3 |
| Wed Oct 7 | 5 | 5 | 4 | 3 |
| Tue Oct 6 | 5 | 3 | 3 | 2 |
Based on LiveCharts.AI's recorded predictions compared with what the market actually did.
What it does and does not say
This page compares recorded RSI and MACD predictions for MBT with the values that printed. It does not say which indicator is better for trading, and the sessions shown are too few to describe the predictions in general.