ZN (10 Year Treasury Note Futures) SMA: which timeframe is most reliable?
10 Year T Note — SMA prediction accuracy on each timeframe, measured.
| Timeframe | Confidence | Position | Directional |
|---|---|---|---|
| 1 Minute | 53.3% | 74.5% | 93.3% |
| 5 Minute | 54.1% | 50.4% | 98.0% |
| 10 Minute | 57.4% | 76.9% | 98.0% |
| 15 Minute | 51.4% | 78.2% | 98.0% |
| 30 Minute | 53.5% | 81.3% | 80.0% |
| 45 Minute | 54.2% | 73.9% | 98.0% |
On directional accuracy the strongest of these is 5 Minute at 98.0%. A slower frame usually sets context while a faster one decides timing, so the most accurate frame is not always the one to trade.
How to read this
Directional accuracy is how often the projected direction proved right; position accuracy is how closely the projected path tracked what actually happened. Confidence is LiveCharts.AI's own read. The live prediction itself is generated inside the platform.
See the live predictions — 7 day free trialSee live predictions on LiveCharts.AI →
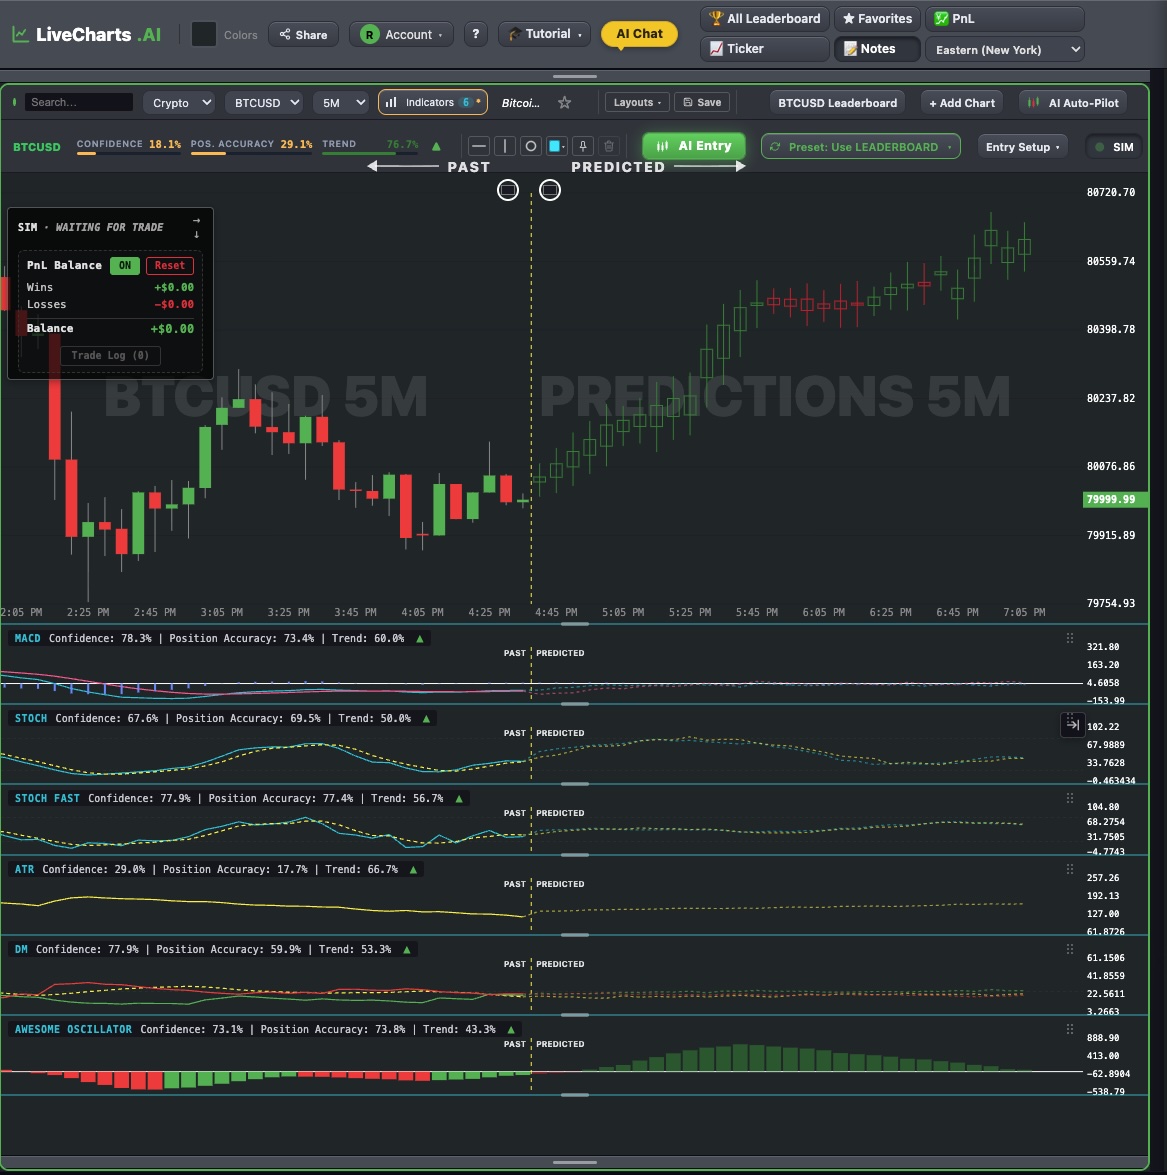
See LiveCharts.AI in action — predicted candlesticks and indicators, 30 bars into the future, before they occur:
Questions traders ask
SMA future path ZN Yes. Alongside the regular SMA, LiveCharts.AI draws the predicted SMA for ZN on every timeframe from 1 minute to 1 hour, updated as each candle closes. Predictive indicators →
Will the current trend continue for ZN? Today's and tomorrow's ZN prediction is live in the LiveCharts.AI app; the record of past 10 Year Treasury Note Futures predictions compared with what happened is on the market page. Market prediction page →
Can ChatGPT read a ZN trading chart? Yes. In LiveCharts.AI you chat with the live ZN chart: ask what the predicted candles imply or where the predicted indicators turn, and the answer is about the chart in front of you. Chat with a trading chart →