BIT (Nano Bitcoin Futures) Std Dev: which timeframe is most reliable?
Bitcoin Futures — Std Dev prediction accuracy on each timeframe, measured.
| Timeframe | Confidence | Position | Directional |
|---|---|---|---|
| 1 Minute | 53.6% | 65.1% | 60.0% |
| 5 Minute | 57.7% | 55.9% | 98.0% |
| 10 Minute | 47.3% | 54.5% | 76.7% |
| 15 Minute | 62.4% | 61.0% | 96.7% |
| 30 Minute | 76.9% | 79.5% | 76.7% |
| 45 Minute | 65.7% | 73.5% | 50.0% |
| 1 Hour | 55.5% | 63.7% | 50.0% |
Track record: does the Standard Deviation prediction call the direction?
| Measured on | Direction right | vs a simple guess | Predictions |
|---|---|---|---|
| 15 minute chart, 90 minutes ahead | 70% | +13% | 300 |
| 15 minute chart, 3 hours ahead | 60% | +13% | 300 |
| 1 hour chart, 12 hours ahead | 60% | +12% | 300 |
| 5 minute chart, 1 hour ahead | 62% | +12% | 296 |
| 5 minute chart, 30 minutes ahead | 63% | +4% | 296 |
A recent finished prediction: made Nov 6, 9:00 AM ET with BIT's Standard Deviation at 169.92, it said higher 90 minutes later (211.63); it was at 239.52 — the direction the prediction called.
Based on LiveCharts.AI's recorded predictions compared with what the market actually did.
On directional accuracy the strongest of these is 5 Minute at 98.0%. A slower frame usually sets context while a faster one decides timing, so the most accurate frame is not always the one to trade.
How to read this
Directional accuracy is how often the projected direction proved right; position accuracy is how closely the projected path tracked what actually happened. Confidence is LiveCharts.AI's own read. The live prediction itself is generated inside the platform.
See the live predictions — 7 day free trialSee live predictions on LiveCharts.AI →
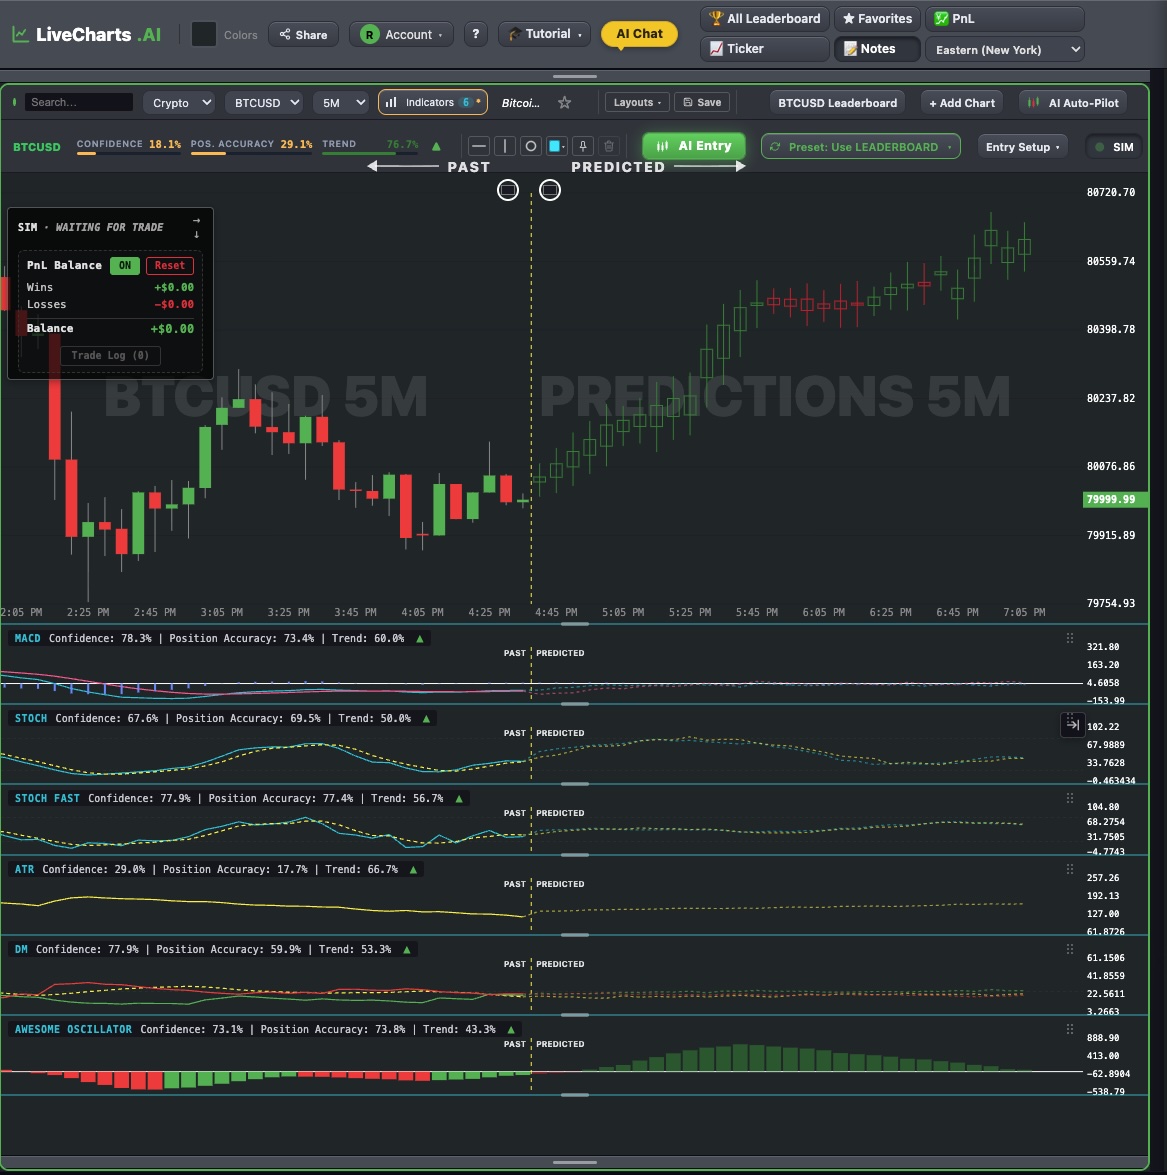
See LiveCharts.AI in action — predicted candlesticks and indicators, 30 bars into the future, before they occur:
Questions traders ask
Crypto predicted Standard Deviation for intraday trading LiveCharts.AI predicts where the Standard Deviation goes next on BIT, up to 30 bars ahead, next to the predicted candles, and publishes how its recent Standard Deviation predictions compared with what happened. Predictive indicators →
Hourly prediction for BIT Today's and tomorrow's BIT prediction is live in the LiveCharts.AI app; the record of past Nano Bitcoin Futures predictions compared with what happened is on the market page. Market prediction page →
AI tools for day trading Nano Bitcoin Futures For day trading Nano Bitcoin Futures, LiveCharts.AI predicts the next candles on the 1, 5, 10 and 15 minute charts and redraws the prediction as each bar closes, so you see when it changes during the session. AI tools for day traders →
More questions traders ask
Crypto live charts On LiveCharts.AI the Nano Bitcoin Futures chart carries its own prediction: candlesticks and indicators 30 bars ahead, before they occur, with recent BIT predictions shown next to what happened. Nano Bitcoin Futures predictions →
Dia crypto prediction For Nano Bitcoin Futures, LiveCharts.AI draws predicted candlesticks and indicators to the right of the live price, and its AI chat answers questions about the BIT chart. Predictions are estimates, not certainties. Nano Bitcoin Futures predictions →
Dia crypto price prediction Open the BIT chart on LiveCharts.AI to see where Nano Bitcoin Futures is now and where its next 30 candles are predicted to go. Past BIT predictions are published next to what the market actually did. Nano Bitcoin Futures predictions →