RTY (Russell 2000 E-mini Futures) — E-mini Russell 2000
Educational reference. Measured from recorded market data and
recorded prediction outcomes — historical readings for learning purposes, not predictions and
not trading advice.
56 recorded pages for RTY — measured movement by time
of day, and predictions compared against the price path that actually followed. Every comparison
covers a window that has already fully passed.
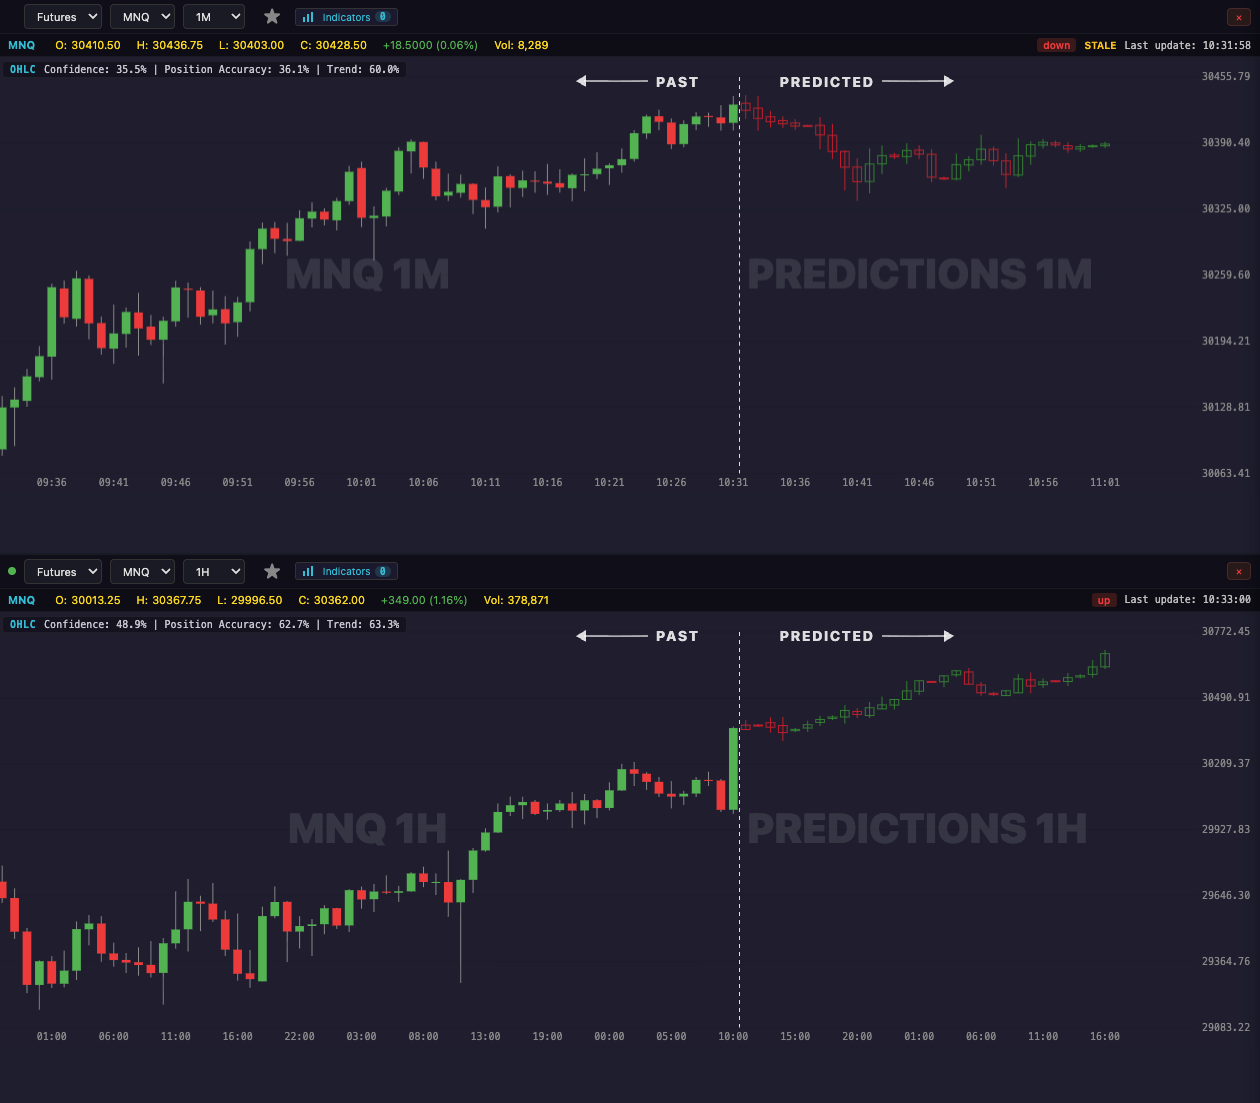
EXAMPLE SCREENSHOT · June 2026Example screenshot of the LiveCharts.AI app from June 2026 — an illustration only. Any prediction lines on it are not current; today's and tomorrow's predictions are only in the live app.
See LiveCharts.AI in action — predicted candlesticks and indicators, 30 bars into the future, before they occur:
Questions traders ask
AI breakdown of Russell 2000 E-mini Futures distribution zones Yes. LiveCharts.AI reads the live RTY chart, draws where the price and the indicators are predicted to go next, and its AI chat explains what the chart is showing in plain language. AI chart analysis →
AI prediction error over 30 candles for Russell 2000 E-mini Futures It depends on the chart and how far ahead. LiveCharts.AI publishes how often its recent RTY predictions got the direction right, chart by chart, so you can compare before relying on one. Can AI predict futures prices? →
Application predicting Russell 2000 E-mini Futures price bars LiveCharts.AI is a prediction app for Russell 2000 E-mini Futures: open the RTY chart on any timeframe and the predicted path appears next to the real one. 7 day free trial. Futures prediction app →
More questions traders ask
RTY futures For Russell 2000 E-mini Futures, LiveCharts.AI draws predicted candlesticks and indicators to the right of the live price, and its AI chat answers questions about the RTY chart. Predictions are estimates, not certainties. Russell 2000 E-mini Futures predictions →
E mini russell 2000 Russell 2000 E-mini Futures (RTY) is live on LiveCharts.AI with the next 30 bars predicted on every timeframe from 1 minute to 1 hour, redrawn as each candle closes. A prediction is an estimate, not a certainty; the market page shows recent RTY predictions next to what happened. Russell 2000 E-mini Futures predictions →
Russell 2000 mini futures Open the RTY chart on LiveCharts.AI to see where Russell 2000 E-mini Futures is now and where its next 30 candles are predicted to go. Past RTY predictions are published next to what the market actually did. Russell 2000 E-mini Futures predictions →