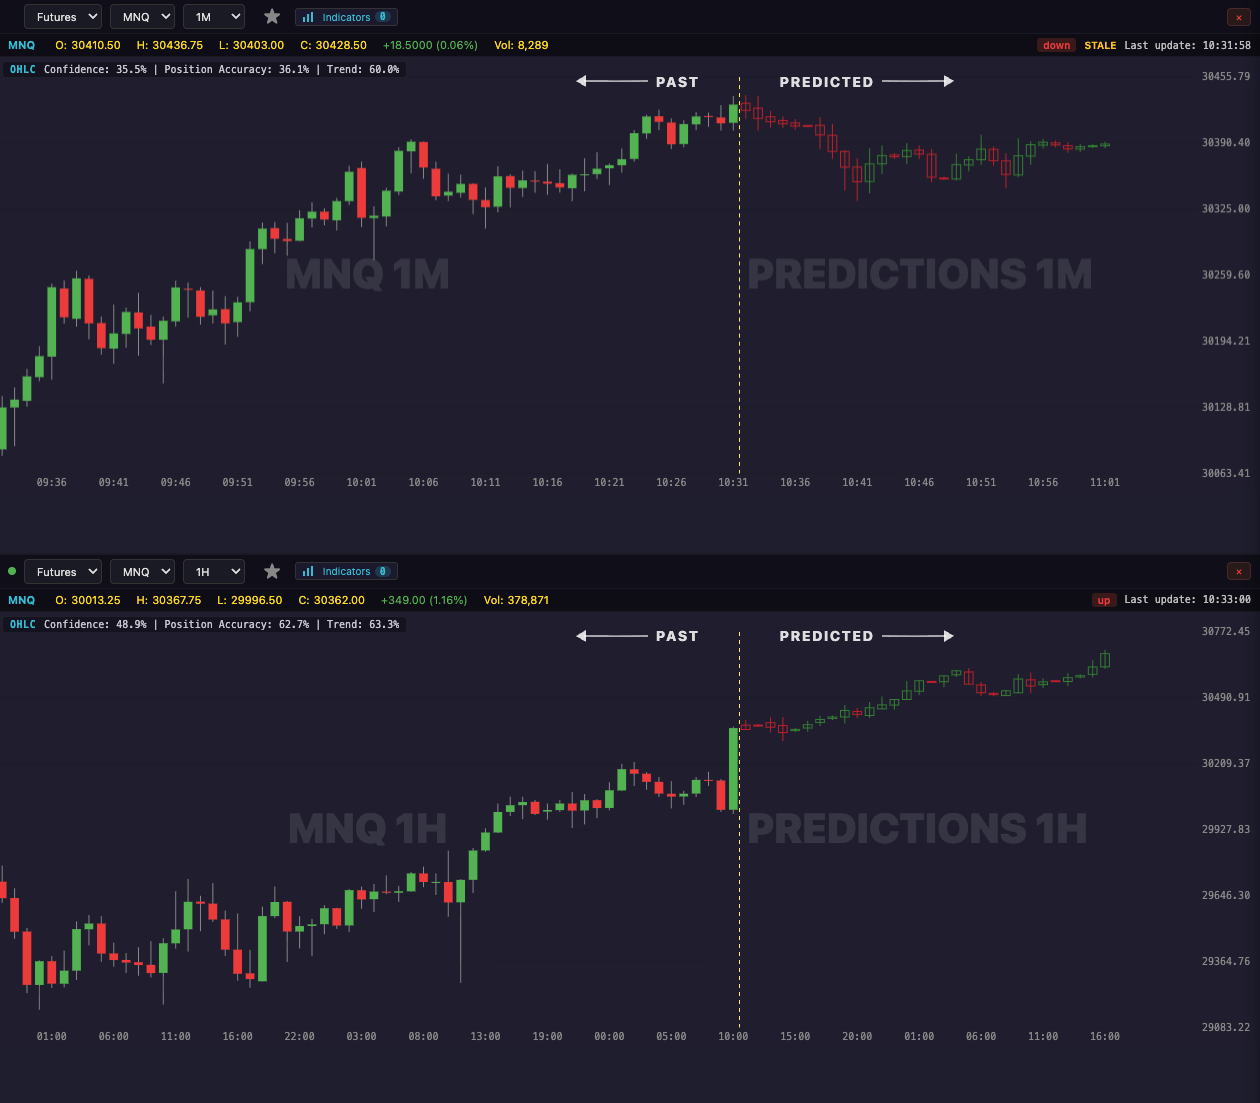
MYM (Micro Dow Futures) 1 Minute: Prediction vs What Actually Happened, September 4 2026 9:18 AM ET
At 9:18 AM ET on Friday, September 4, LiveCharts.AI projected the next 30 1 minute bars of Micro E-mini Dow. The chart below that shows what the market actually did over the same window. Both panels use the identical price scale, so the shapes can be compared directly.
| Per bar direction agreement | 19/30 bars — 63.3% |
| Net direction from start | 21/30 bars — 70.0% |
| Bars projected | 30 × 1 minute |
| Price at prediction time | 53,551.00 |
| Where it actually ended | 53,615.00 |
| Where the projection ended | 53,591.49 |
| Size of the move | projected 40.49 vs actual 64.00 (0.63×) |
How this page is selected
Two measurements have to agree for a window to be shown. Per bar direction asks, for each interval, whether the projection and the market moved the same way from the previous bar — here 63.3%. Net direction asks whether both were on the same side of the starting price — here 70.0%. A third measurement checks the SIZE of the move: the projected distance travelled against the actual, here 0.63×. A window has to satisfy all three to appear — agreeing on direction while badly missing the size is not a match.
What it does and does not say
This is one recorded window, selected because the paths agreed. It is not a typical result, not an average, and not a claim about future accuracy. Aggregate measurements across all recorded predictions are the honest place to judge accuracy overall.
The prediction shown here has fully matured and was compared against recorded market data after the fact. Live projections are part of the LiveCharts.AI platform and are not published here.