How LiveCharts.AI Predictions Have Measured on MES (Micro S&P 500 Futures) 1 Minute, by Time of Day
Every prediction LiveCharts.AI produces is recorded — which means it can be graded. The table below takes 394 recorded MES 1 minute predictions across 45 sessions, compares the direction each one projected against what price actually did 15 minutes later, and reports the agreement rate by time of day. Sample sizes are shown beside every figure, and the numbers firm up as more sessions are recorded.
| Session | Agreements | Directional agreement |
|---|---|---|
| Morning (9:30 AM – noon ET) | 54/110 | 49.1% |
| Afternoon (noon – 4:00 PM ET) | 27/54 | 50.0% |
| Early pre market (3:00 – 9:30 AM ET) | 42/81 | 51.9% |
| Evening / overnight | 69/149 | 46.3% |
| All hours | 192/394 | 48.7% |
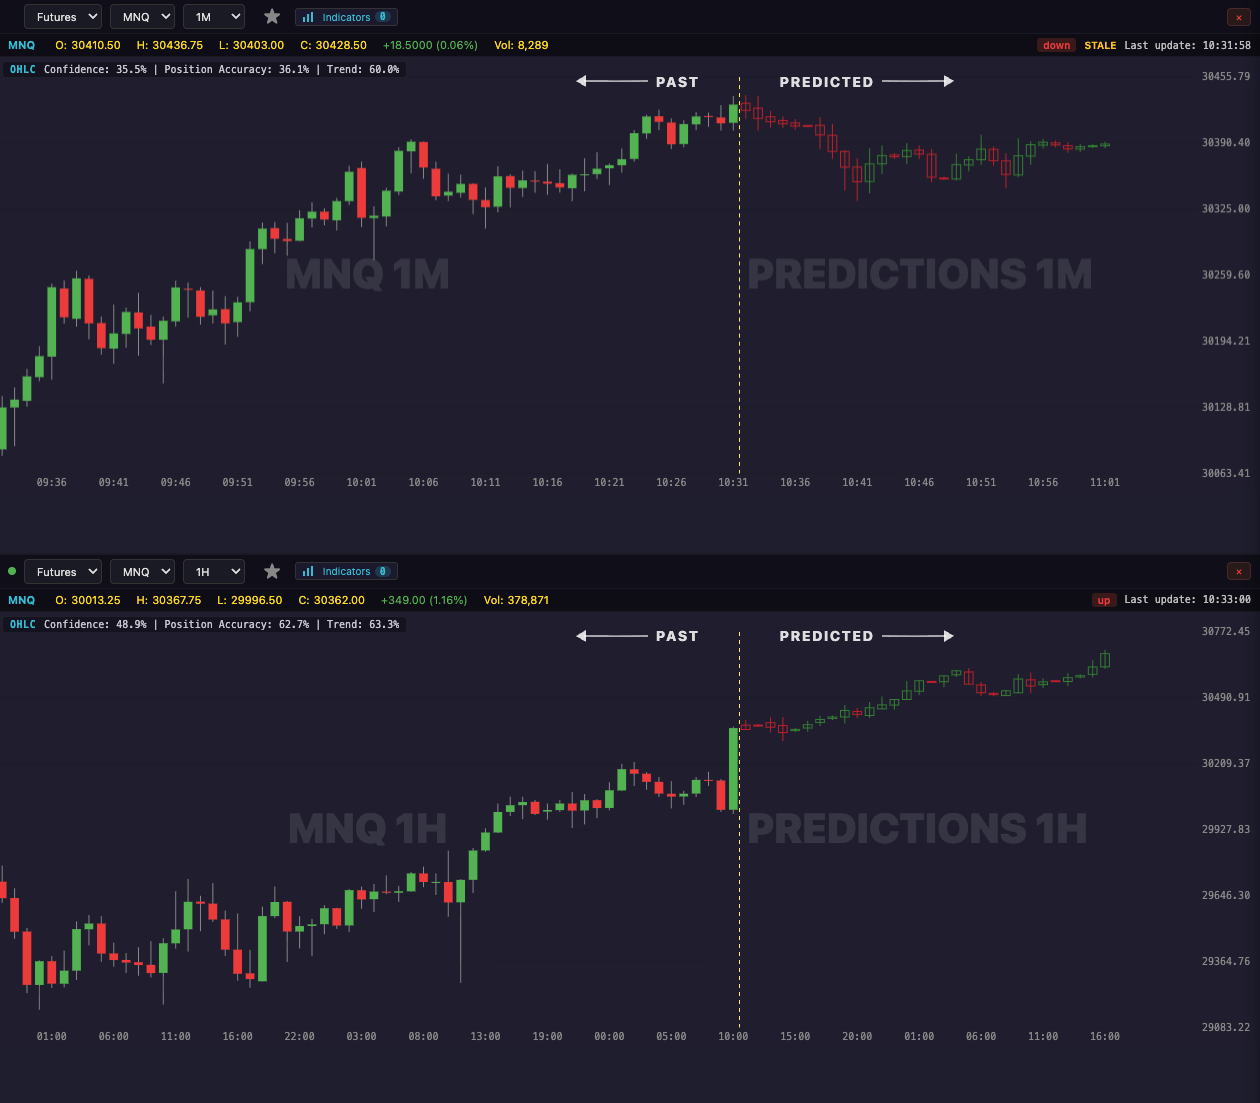
How this is measured
For each recorded prediction: the projected direction is the last predicted close versus the close at the moment the prediction was made; the realized direction is the actual close 15 minutes later, from bars recorded afterward. Same direction = agreement. Predictions and outcomes with no net movement are excluded rather than counted either way.
What the split shows
Time of day differences are normal: the market's character changes between the open, lunch, and the close, and measured agreement changes with it. These are recorded outcomes for the window above — they move as conditions move, and no past rate promises a future one.
The predictions themselves — the live projected bars — are part of the LiveCharts.AI platform and are not published here.