Prediction Outcomes by Stated Confidence
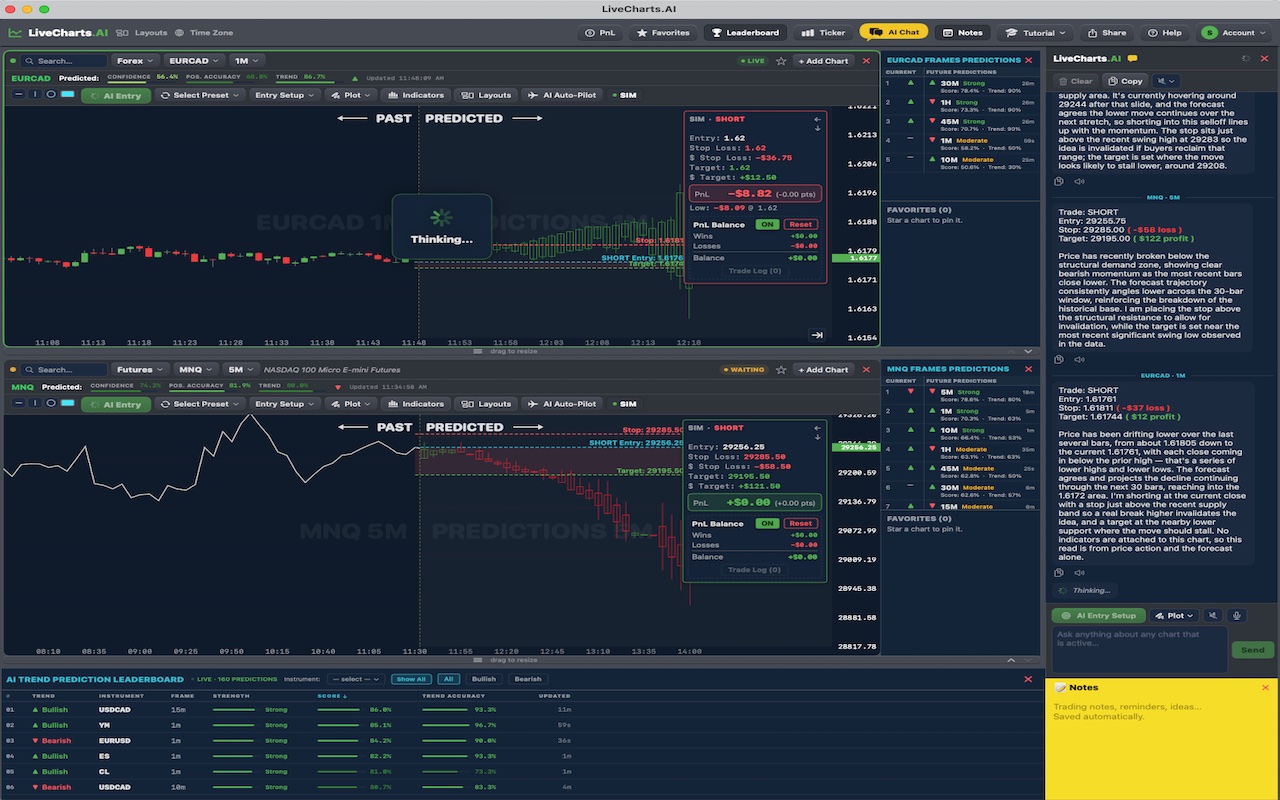
Every LiveCharts.AI prediction is displayed with a stated confidence percentage — and every prediction is recorded, which means the confidence figure itself can be graded. The table below takes 318 fully matured predictions across 8 markets and 19 recent sessions. Sample sizes are shown beside every figure, and the numbers firm up as more sessions are recorded.
| Stated confidence at prediction time | Agreements | Directional agreement |
|---|---|---|
| Below 45% | 74/148 | 50.0% |
| 45% – 55% | 54/98 | 55.1% |
| 55% – 65% | 33/64 | 51.6% |
| All predictions | 165/318 | 51.9% |
How this is measured
Only fully matured predictions are included — predictions whose entire projected window already lies in the past. For each one, the projected direction is compared against the actual close 15 bars later, from prices recorded afterward; same direction counts as agreement. The confidence bucket is the percentage displayed at the moment the prediction was made. Nothing on this page is a live prediction.
What the comparison shows
A stated confidence figure is only meaningful if outcomes differ across its range — that is what this table measures, and keeps measuring as the recorded sample grows. These are historical outcomes for the window above; they move as conditions move, and no past rate promises a future one.