MNQ 2-minute projections, measured
Educational reference. Measured from 243 completed 2-minute windows, the most recent ending Friday, September 4, 2026.
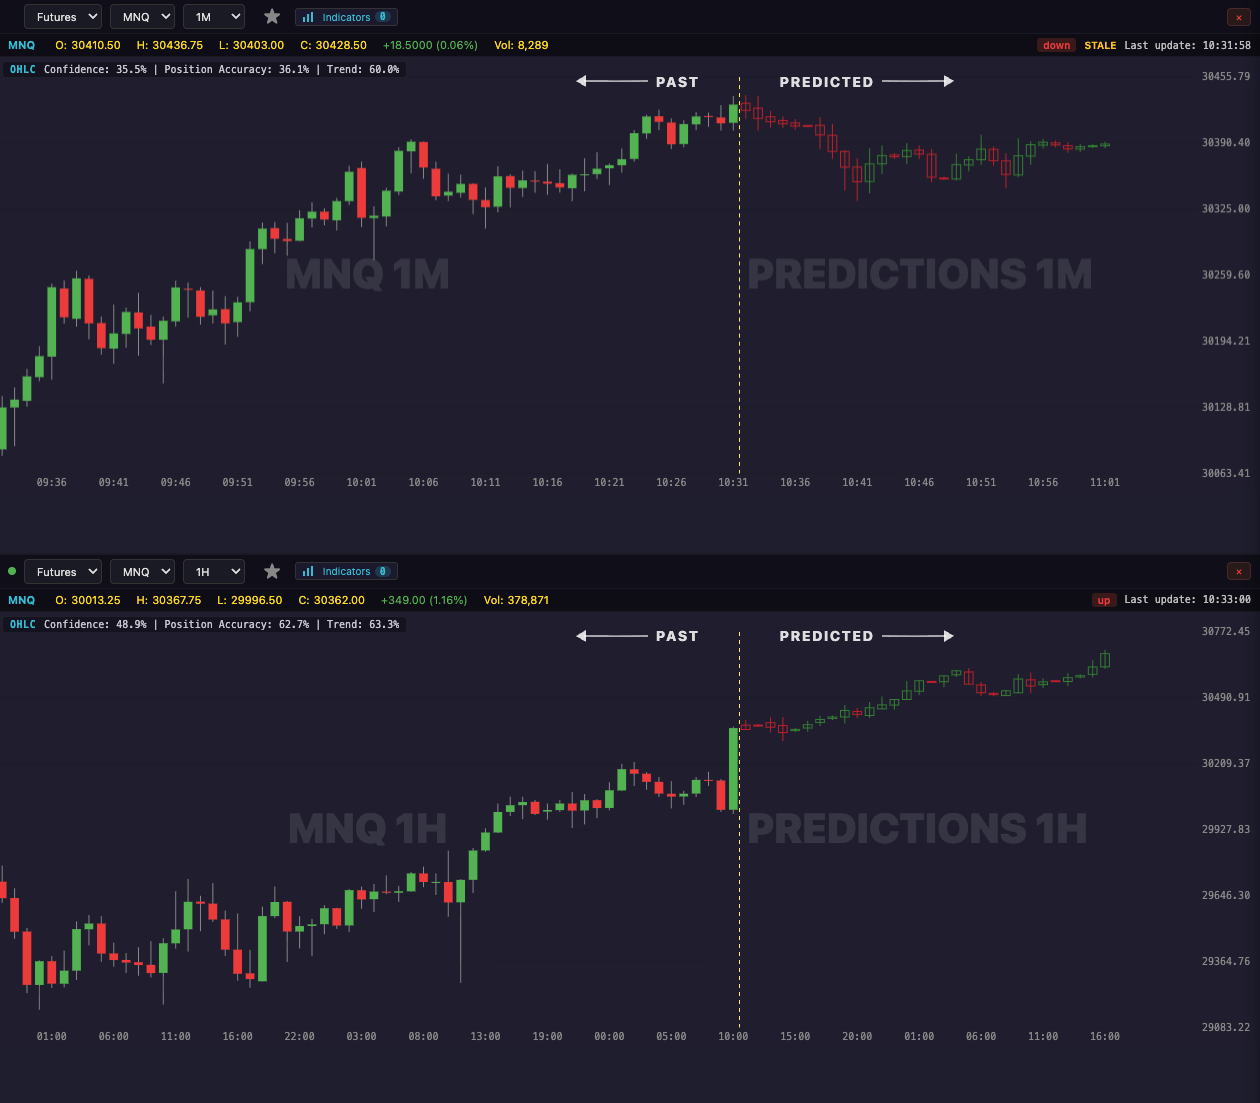
Across 243 completed 2-minute windows on MNQ, the projection ended on the correct side of the starting price in 45.7% of them. The median difference between the projected and actual closing price at the final bar was 88.0 points, measured against a median actual move of 25.0 points.
| Period | Completed windows | Ended on the projected side | Bar-to-bar agreement (median) | Median final-bar difference | Median actual move |
|---|---|---|---|---|---|
| Last 7 days | 243 | 45.7% | 50.0% | 88.0 | 25.0 |
| Last 30 days | 243 | 45.7% | 50.0% | 88.0 | 25.0 |
| All recorded | 243 | 45.7% | 50.0% | 88.0 | 25.0 |
Reading these two measures together
Bar-to-bar agreement — 50.0% here — counts how often the projection and the market moved the same way from one bar to the next. Ending on the projected side, 45.7%, asks the different question of whether the window finished where the projection pointed. The two measure different things, and a projection can track short-term movement closely while still finishing some distance from the actual close.
In 2% of completed windows the projected move was smaller than the move that actually occurred, so the projection understated the size of the move more often than it overstated it.
What is counted here
Every matured window is included — nothing is selected. A window is counted only once its entire projected span is in the past. The individual comparison pages listed below are a deliberately chosen subset, published only where the projection tracked the market closely on three separate measures; they are worked examples and are not the sample behind the figures above.
Nothing on this page is a live projection, and none of it describes what any future window will do.
Method
Each window is one recorded projection of 2-minute closing prices compared against the closes that actually printed over the same span. Both the projected and actual finishing prices are measured from the price at the moment the projection was made. Windows shorter than 20 bars, and windows where the market finished exactly level, are excluded.
Individual comparisons
- None published for this combination yet.