MYM (Micro Dow Futures): which chart and reading does LiveCharts.AI read best?
Micro E-mini Dow — every qualifying chart ranked by measured directional accuracy.
| Chart & reading | Median directional | Best | Charts |
|---|---|---|---|
| 10 Minute Keltner Channel | 98.0% | 69.9% | 67 |
| 10 Minute MACD | 98.0% | 68.6% | 57 |
| 10 Minute Parabolic SAR | 98.0% | 55.7% | 60 |
| 10 Minute SMA | 98.0% | 78.3% | 70 |
| 10 Minute VWMA | 98.0% | 79.0% | 66 |
| 15 Minute EMA | 98.0% | 73.1% | 59 |
| 15 Minute MAMA | 98.0% | 58.0% | 56 |
| 1 Hour Bollinger | 98.0% | 74.9% | 56 |
| 1 Hour EMA | 98.0% | 78.8% | 56 |
| 1 Hour Price | 98.0% | 55.5% | 45 |
| 1 Hour Parabolic SAR | 98.0% | 62.1% | 46 |
| 1 Hour SMA | 98.0% | 82.3% | 54 |
Median and best directional accuracy. “Charts” is how many qualifying charts fed each row — the sample size behind the median, not a page count. Measured, not estimated.
The strongest combination for MYM is 10 Minute Keltner Channel at 98.0% directional accuracy.
What these numbers are
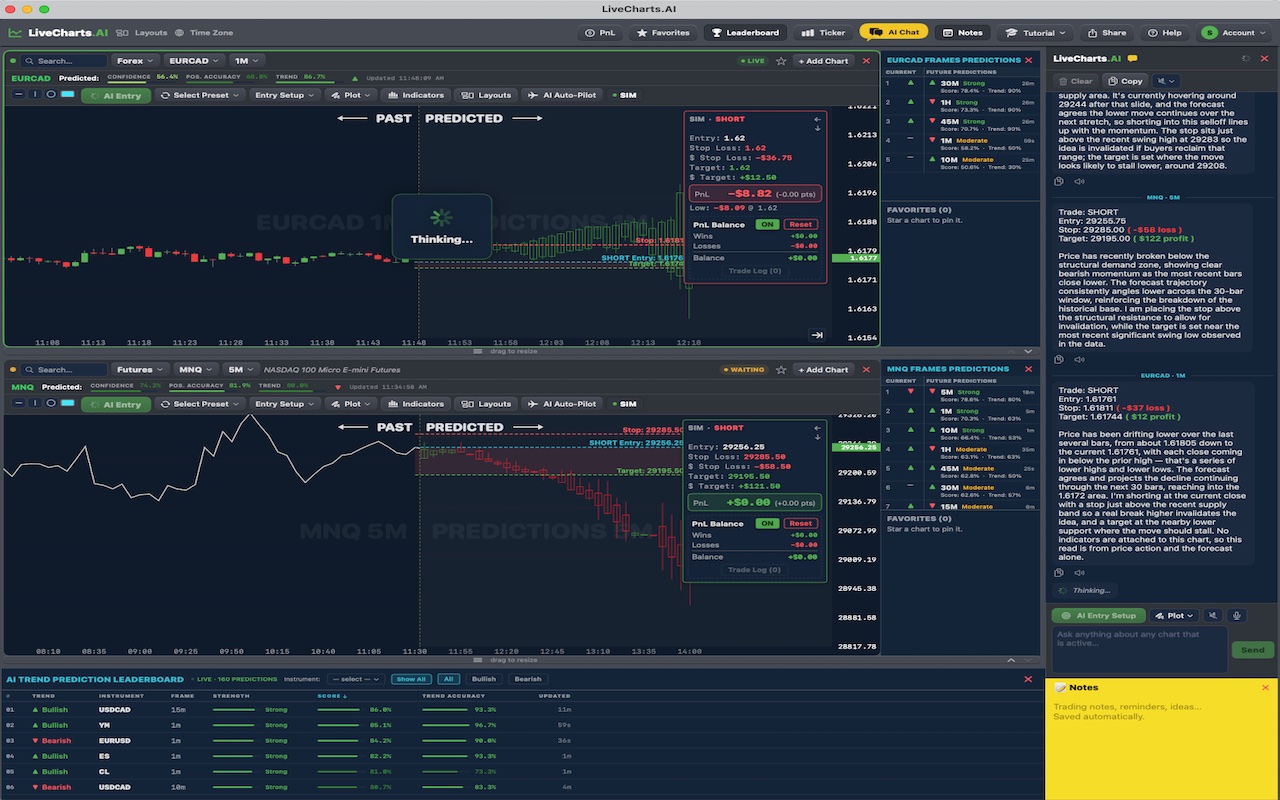
Directional accuracy is how often the projected direction proved correct, measured against what price actually did. It is not a claim about future performance. The predictions themselves are produced inside the platform.
See the live predictions — 7 day free trialSee live predictions on LiveCharts.AI →
LiveCharts.AI disclaimer: trading involves risk of substantial loss and is not suitable for every investor. LiveCharts.AI provides technical analysis tools and predictions for educational and informational purposes only; outcomes vary and individual results may differ from any examples shown. Historical performance is not indicative of future outcomes. Only invest capital you can afford to lose and consult a licensed financial advisor before making investment decisions.