AI Crypto Chart Analysis — Bitcoin and Ethereum
LiveCharts.AI does AI crypto chart analysis on a live chart: open Bitcoin or Ethereum and the predicted next 30 candles appear to the right of the last bar, on every timeframe from 1 minute to 1 hour, with the AI chat ready to explain what the chart is showing.
Analyze a crypto chart — 7 day free trial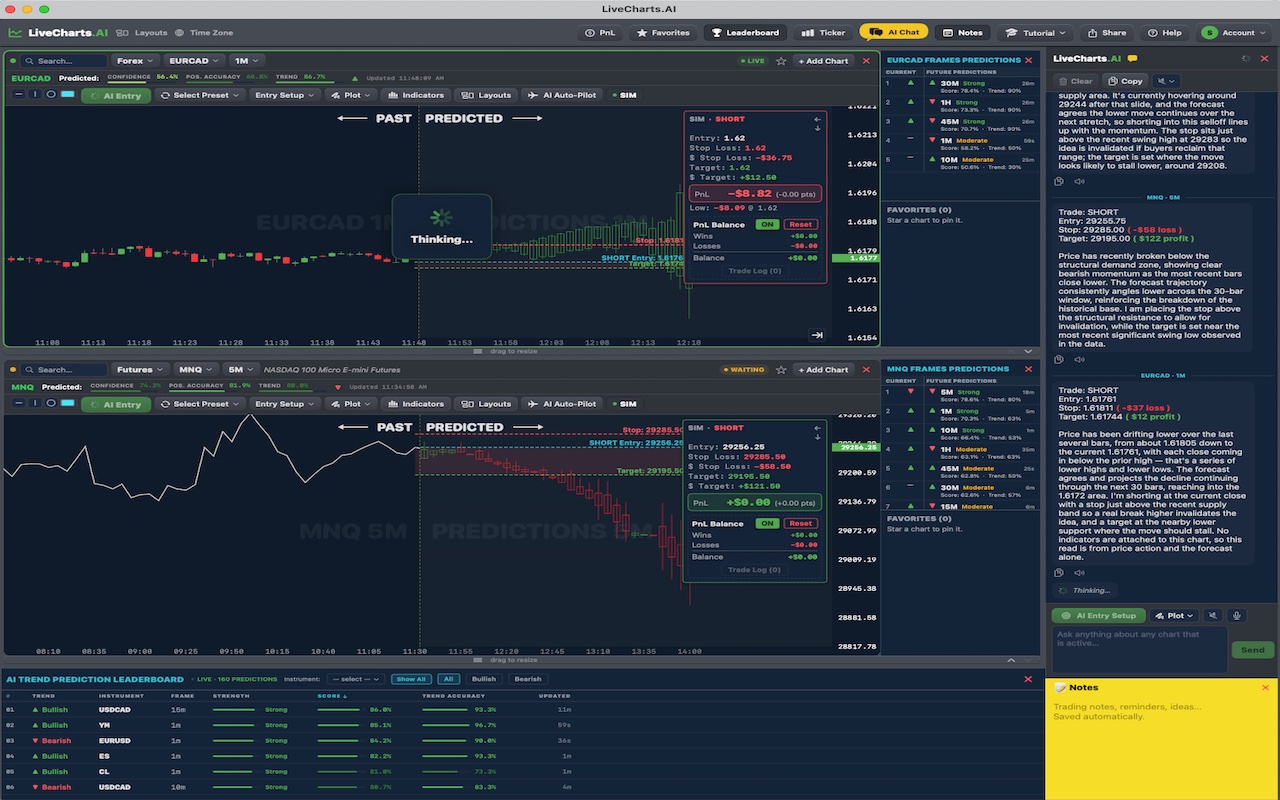
AI Bitcoin chart analysis
On the Bitcoin chart (BTCUSD, and the Bitcoin futures MBT) the prediction shows where the price and indicators like MACD, RSI and Stochastics are predicted to go next, redrawn as each candle closes.
AI Ethereum chart analysis
The same for Ethereum (ETHUSD, and the Micro Ether futures MET): predicted candles and predicted indicators, side by side with the real chart.
How often the crypto prediction gets the direction right
| Market | Chart | Direction right |
|---|---|---|
| Bitcoin (BTCUSD) | 10 minute chart, 1 hour ahead | 58% |
| Ethereum (ETHUSD) | 10 minute chart, 2 hours ahead | 61% |
| Bitcoin futures (MBT) | 15 minute chart, 90 minutes ahead | 59% |
| Micro Ether futures (MET) | 10 minute chart, 2 hours ahead | 63% |
Based on LiveCharts.AI's recorded predictions compared with what the market actually did.
Ask the chart
Ask the AI chat what the crypto chart is doing: where the prediction turns, the predicted highs and lows, or how today compares with yesterday.
More: Bitcoin price prediction · Ethereum price prediction · AI chart analysis · AI trading assistant