Gold futures Bollinger Bands Prediction (GC, MGC)
LiveCharts.AI predicts the next 30 bars of the Bollinger Bands for gold futures — GC and MGC — on every timeframe. This page records how those predictions compared with what the Bollinger Bands actually did. Every number below is from predictions whose whole path has already happened.
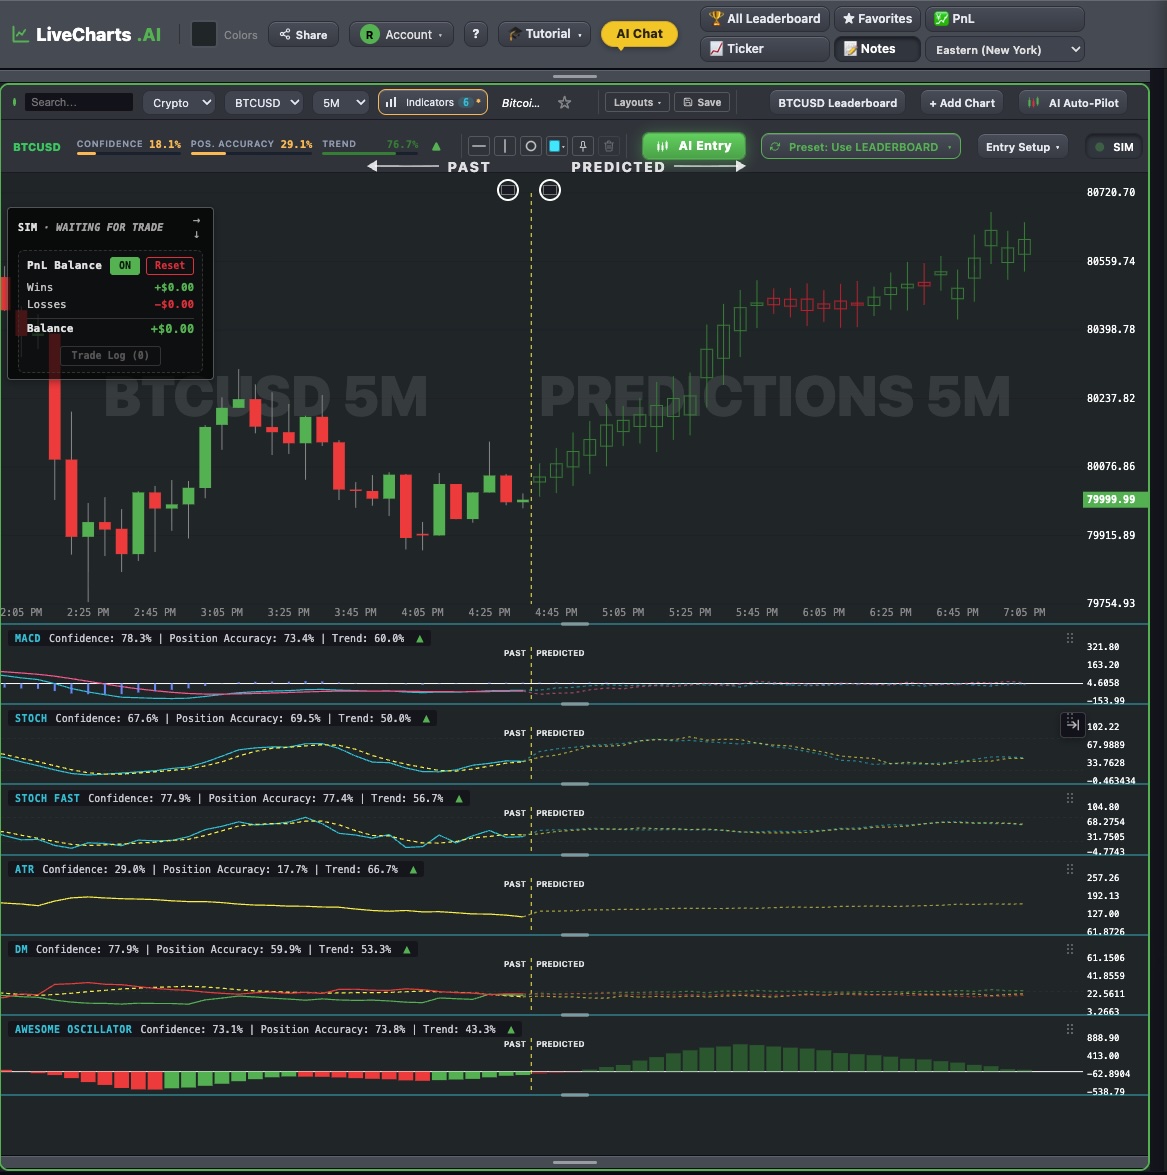
A recent 15-minute Bollinger Bands prediction vs what happened
Made Oct 6, 2:00 PM ET with GC's Bollinger Bands at 4,197: the prediction said it would be higher 3 hours later (4,211). It was at 4,205 — the direction the prediction called.
How often the Bollinger Bands prediction calls the direction
| Measured on | Direction right | Edge | Predictions |
|---|---|---|---|
| 15-minute chart, 3 hours ahead | 66% (GC) · 66% (MGC) | +12% vs a simple guess | 300 |
| 15-minute chart, 90 minutes ahead | 71% (GC) · 71% (MGC) | +7% vs a simple guess | 300 |
"Direction right" = the Bollinger Bands ended up above or below its starting value, as predicted. "Edge" compares it with a simple guess (the indicator keeps moving the way it was moving). Only finished predictions; re-measured every day.
See the live Bollinger Bands prediction on the gold futures chart →More: Gold futures live chart & prediction · GC prediction accuracy by timeframe · All markets