RTY 15-Minute RSI Prediction Accuracy
RTY — how LiveCharts.AI predictions for RSI on the 15-minute chart have measured up.
| Prediction direction | View live → |
| LiveCharts.AI confidence | 55.6% |
| Position accuracy | 58.8% |
| Directional accuracy | 96.7% |
These are measured outcomes, not estimates. Position accuracy of 58.8% reflects how closely the projected path tracked what RSI actually did; directional accuracy of 96.7% reflects how often the projected direction was right.
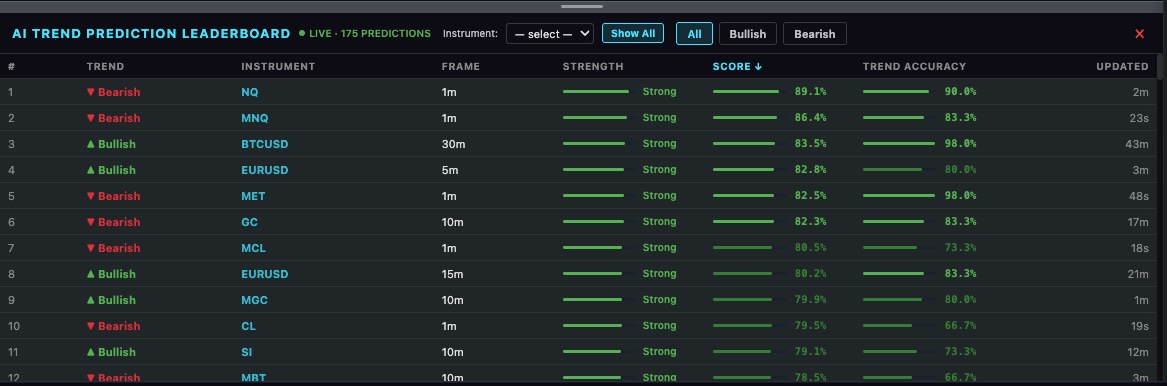
LiveCharts.AI projecting RSI and price forward on a live chart.
What this reading is
RSI compares the size of recent gains with recent losses on a 0-100 scale, so it describes how stretched a move has become. Predicting it means projecting whether that stretch is building or easing. On directional accuracy this ranks 4 of 10 readings on this chart, above the median of 93.3%.
Why the timeframe changes the read
The same prediction reads differently depending on the chart you act on. A slower frame sets context; a faster one decides timing. RTY on the 15-minute chart is one view of RSI, and comparing it against the other frames below is usually more useful than any single number.
How the prediction is produced
Rather than only plotting what has already happened, LiveCharts.AI projects the next 30 bars forward — for price and for each indicator you have enabled. The projected path and the live direction are generated inside the platform for whichever chart you have open.
See the live RTY 15-Minute prediction — 7-day free trialSee live predictions on LiveCharts.AI →